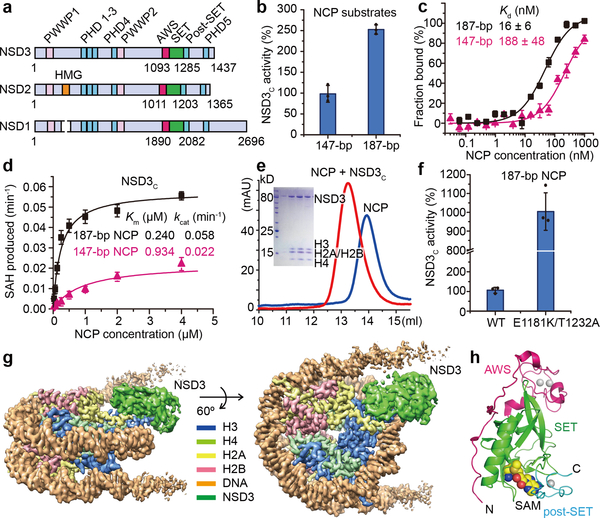
Fig. 1 |.
Biochemical analysis of NSD3 and the overall structure of the NSD3-E1181K/T1232A-NCP complex. a, Domain architecture of the NSD family proteins. b, Catalytic activities of NSD3C on 147-bp and 187-bp NCPs measured through an in vitro methylation method. Signals for 147-bp NCP were set as 100%. c, MST-based binding curves of NSD3C with 147-bp and 187-bp NCPs. d, Michaelis-Menten titrations of NSD3 with147-bp and 187-bp NCPs. e, Gel-filtration profiles of NCPs with or without bound NSD3C. SDS-PAGE gel is shown as an insert. For gel source data, see Supplementary Fig. 1. The experiment has been repeated at least three times with similar results. f, Catalytic activities of wild-type (WT) NSD3C and its E1181K/T1232A mutant on 187-bp NCPs measured through an in vitro methylation method. g, Side (left) and top (right) views of the sharpened cryo-EM density map of the 1:1 NSD3-NCP complex (contour at 3σ level). H3, H4, H2A, H2B, DNA and NSD3 are colored in blue, lime green, yellow, red, orange and grass green, respectively. h, Domain architecture of the AWS, SET and post-SET domains of NSD3, which are colored in magenta, green and cyan, respectively. Data in panels b, c, d and f are represented as means ± s.d. from n = 3 independent samples.

