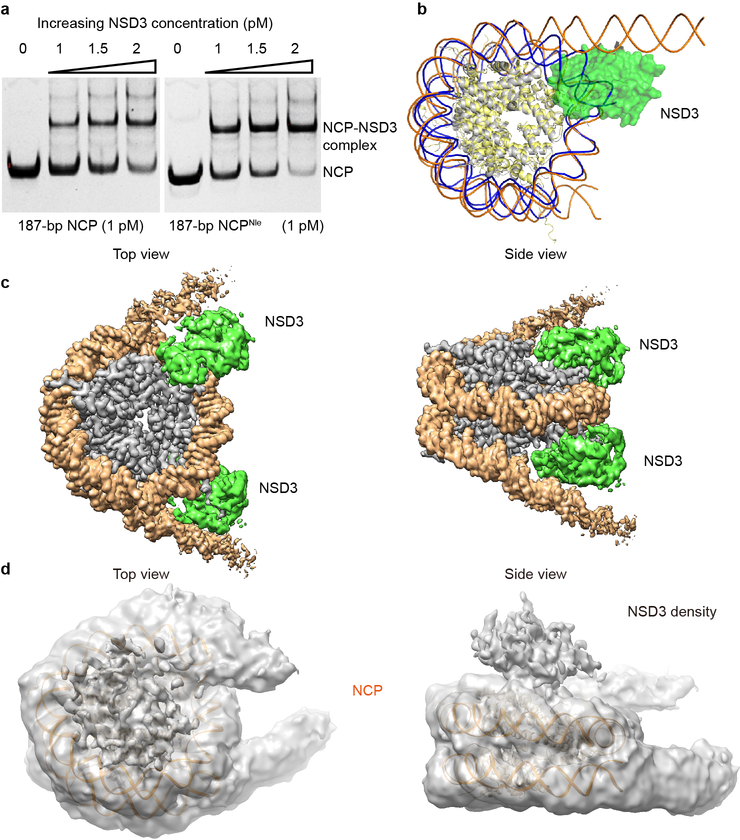
Extended Data Fig. 3 |.
EMSA and structural analysis of NSD3C with 187-bp NCPs. a, EMSA analysis of NSD3C with native or Nle-labeled187-bp NCPs. The concentrations of added NSD3C are indicated above the lanes. The results were repeated from at least three independent experiments. For gel source data, see Supplementary Fig. 1. b, Superimposition of the 1:1 NSD3-NCP complex with an apo NCP (PDB ID: 1AOI). Histone proteins and the wrapped DNA in apo NCP are colored in yellow and blue, respectively. Histone proteins and the nucleosomal DNA in the NSD3-binding NCP are colored in grey and orange, respectively. NSD3 is colored in green. c, Top (left) and side (right) views of the sharpened cryo-EM density map of the 1:2 NCP-NSD3C-E1181K/T1232A complex (contour at 3σ level). NSD3 is colored in green. NCP DNA and histone proteins are colored in orange and grey, respectively. d, Top (left) and side (right) views of the inactive state of the NSD3C-NCP complex. 146-bp NCP structure (PDB code 1AOI) was docked into the density of the 187-bp NCP. The cryo-EM density map was colored in grey and contoured at 1.5σ lever. Additional densities that lay on the top of the nucleosome disk were densities of NSD3.

