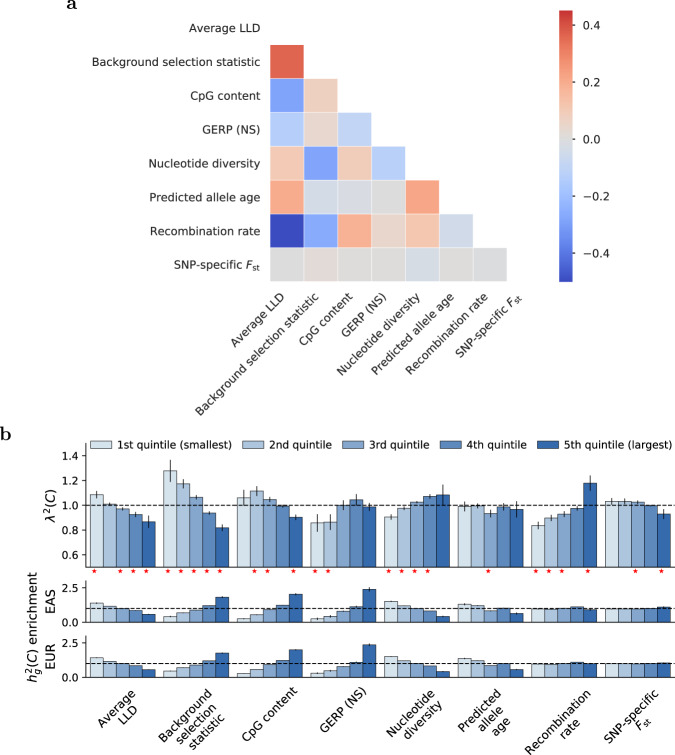
Fig. 2. S-LDXR results for quintiles of 8 continuous-valued annotations across 31 diseases and complex traits.
a We report correlations between each continuous-valued annotation; diagonal entries are not shown. Numerical results are reported in Supplementary Data 1. b We report estimates of the enrichment/depletion of squared trans-ethnic genetic correlation (λ2(C)), as well as population-specific estimates of heritability enrichment, for quintiles of each continuous-valued annotation. Results are meta-analyzed across 31 diseases and complex traits. Error bars denote ± 1.96 × standard error of the meta-analyzed λ2(C). P-values are obtained from the standard normal distribution. Red stars (⋆) denote two-tailed p < 0.05/40. Numerical results are reported in Supplementary Data 15.

