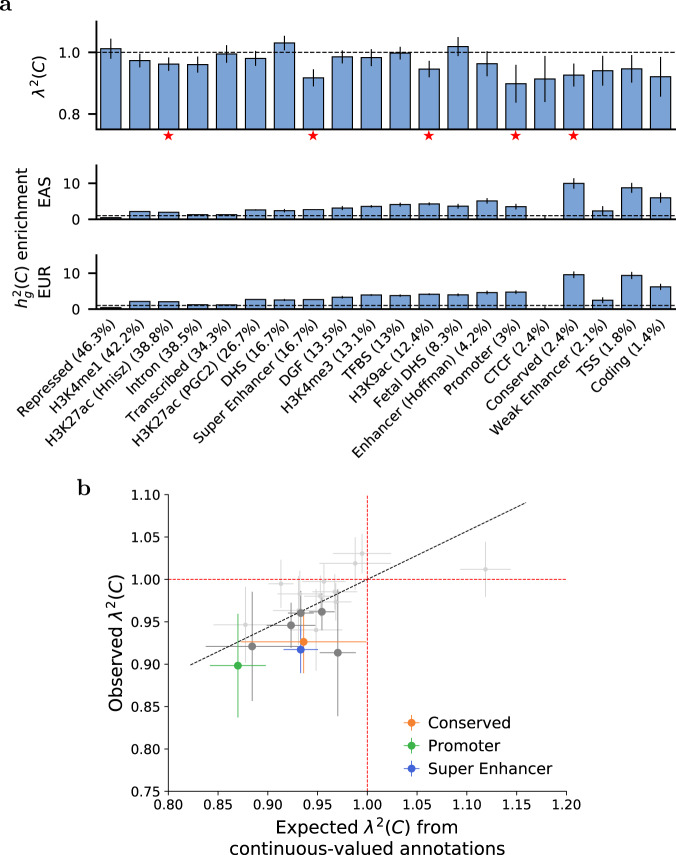
Fig. 3. S-LDXR results for 20 binary functional annotations across 31 diseases and complex traits.
a We report estimates of the enrichment/depletion of squared trans-ethnic genetic correlation (λ2(C)), as well as population-specific estimates of heritability enrichment, for each binary annotation (sorted by proportion of SNPs, displayed in parentheses). Results are meta-analyzed across 31 diseases and complex traits. Error bars denote ± 1.96 × standard error. Red stars (⋆) denote two-tailed p < 0.05/20. Numerical results are reported in Supplementary Data 16. b We report observed λ2(C) vs. expected λ2(C) based on 8 continuous-valued annotations, for each binary annotation. Results are meta-analyzed across 31 diseases and complex traits. Error bars denote ± 1.96 × standard error of the meta-analyzed λ2(C). P-values are obtained from the standard normal distribution. Annotations for which λ2(C) is significantly different from 1 (p < 0.05/20) are denoted in color (see legend) or dark gray. The dashed black line (slope = 0.57) denotes a regression of observed λ(C) − 1 vs. expected λ(C) − 1 with intercept constrained to 0. Numerical results are reported in Supplementary Data 17.

