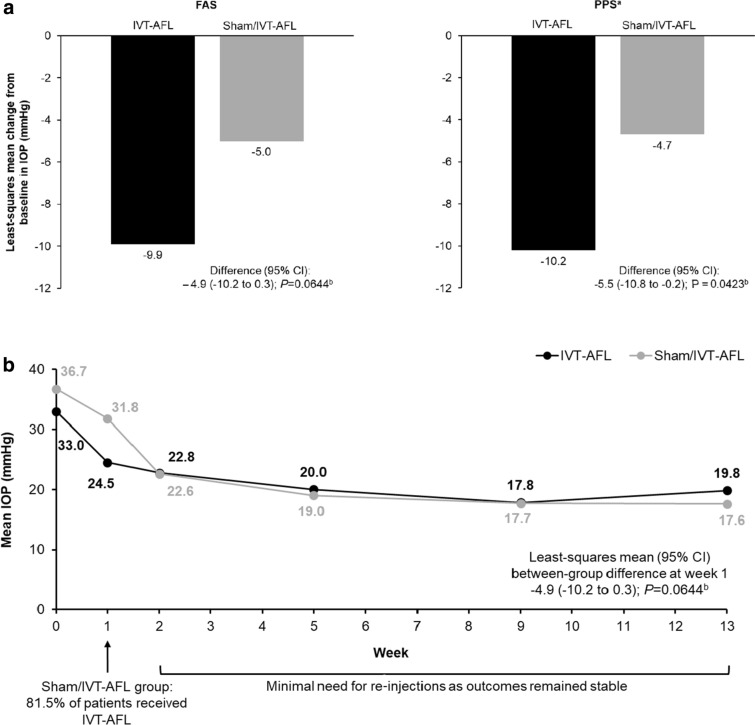
Fig. 2.
Mean change in IOP from baseline to week 1 (a) and mean IOP from baseline to week 13 (b). aA sensitivity analysis of the primary endpoint was performed on the PPS. bCalculated using ANCOVA model, with treatment group and stage of NVG randomization as fixed effects, with baseline value as covariate; ANCOVA analysis of covariance, FAS full analysis set, IOP intraocular pressure, IVT-AFL intravitreal aflibercept, NVG neovascular glaucoma, PPS per-protocol set

