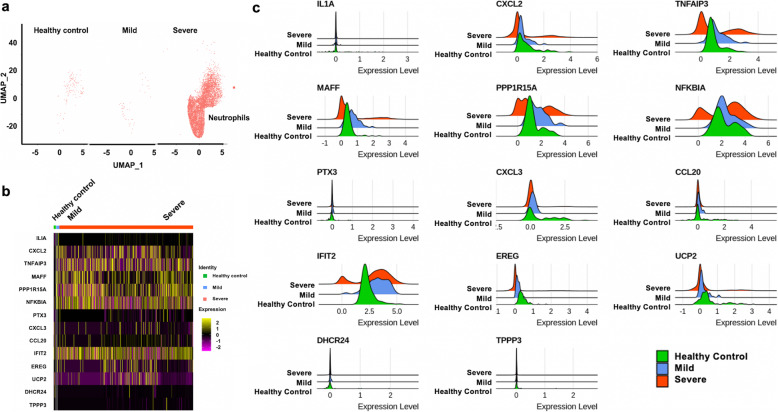
Fig. 2.
Expression of signature genes in neutrophils from respective patient groups. a Uniform Manifold Approximation and Projection (UMAP) plots of the neutrophils. Each dot corresponds to one single cell. b Heatmap of fourteen signature genes in three groups. Each vertical bar represents a single cell. Column (cell identity) width is proportional to the number of cells present in that cluster. c Distributions of signature gene expression shown in ridge plots. Red, blue and green colors represent gene expression values in severe, mild patients and healthy controls, respectively

