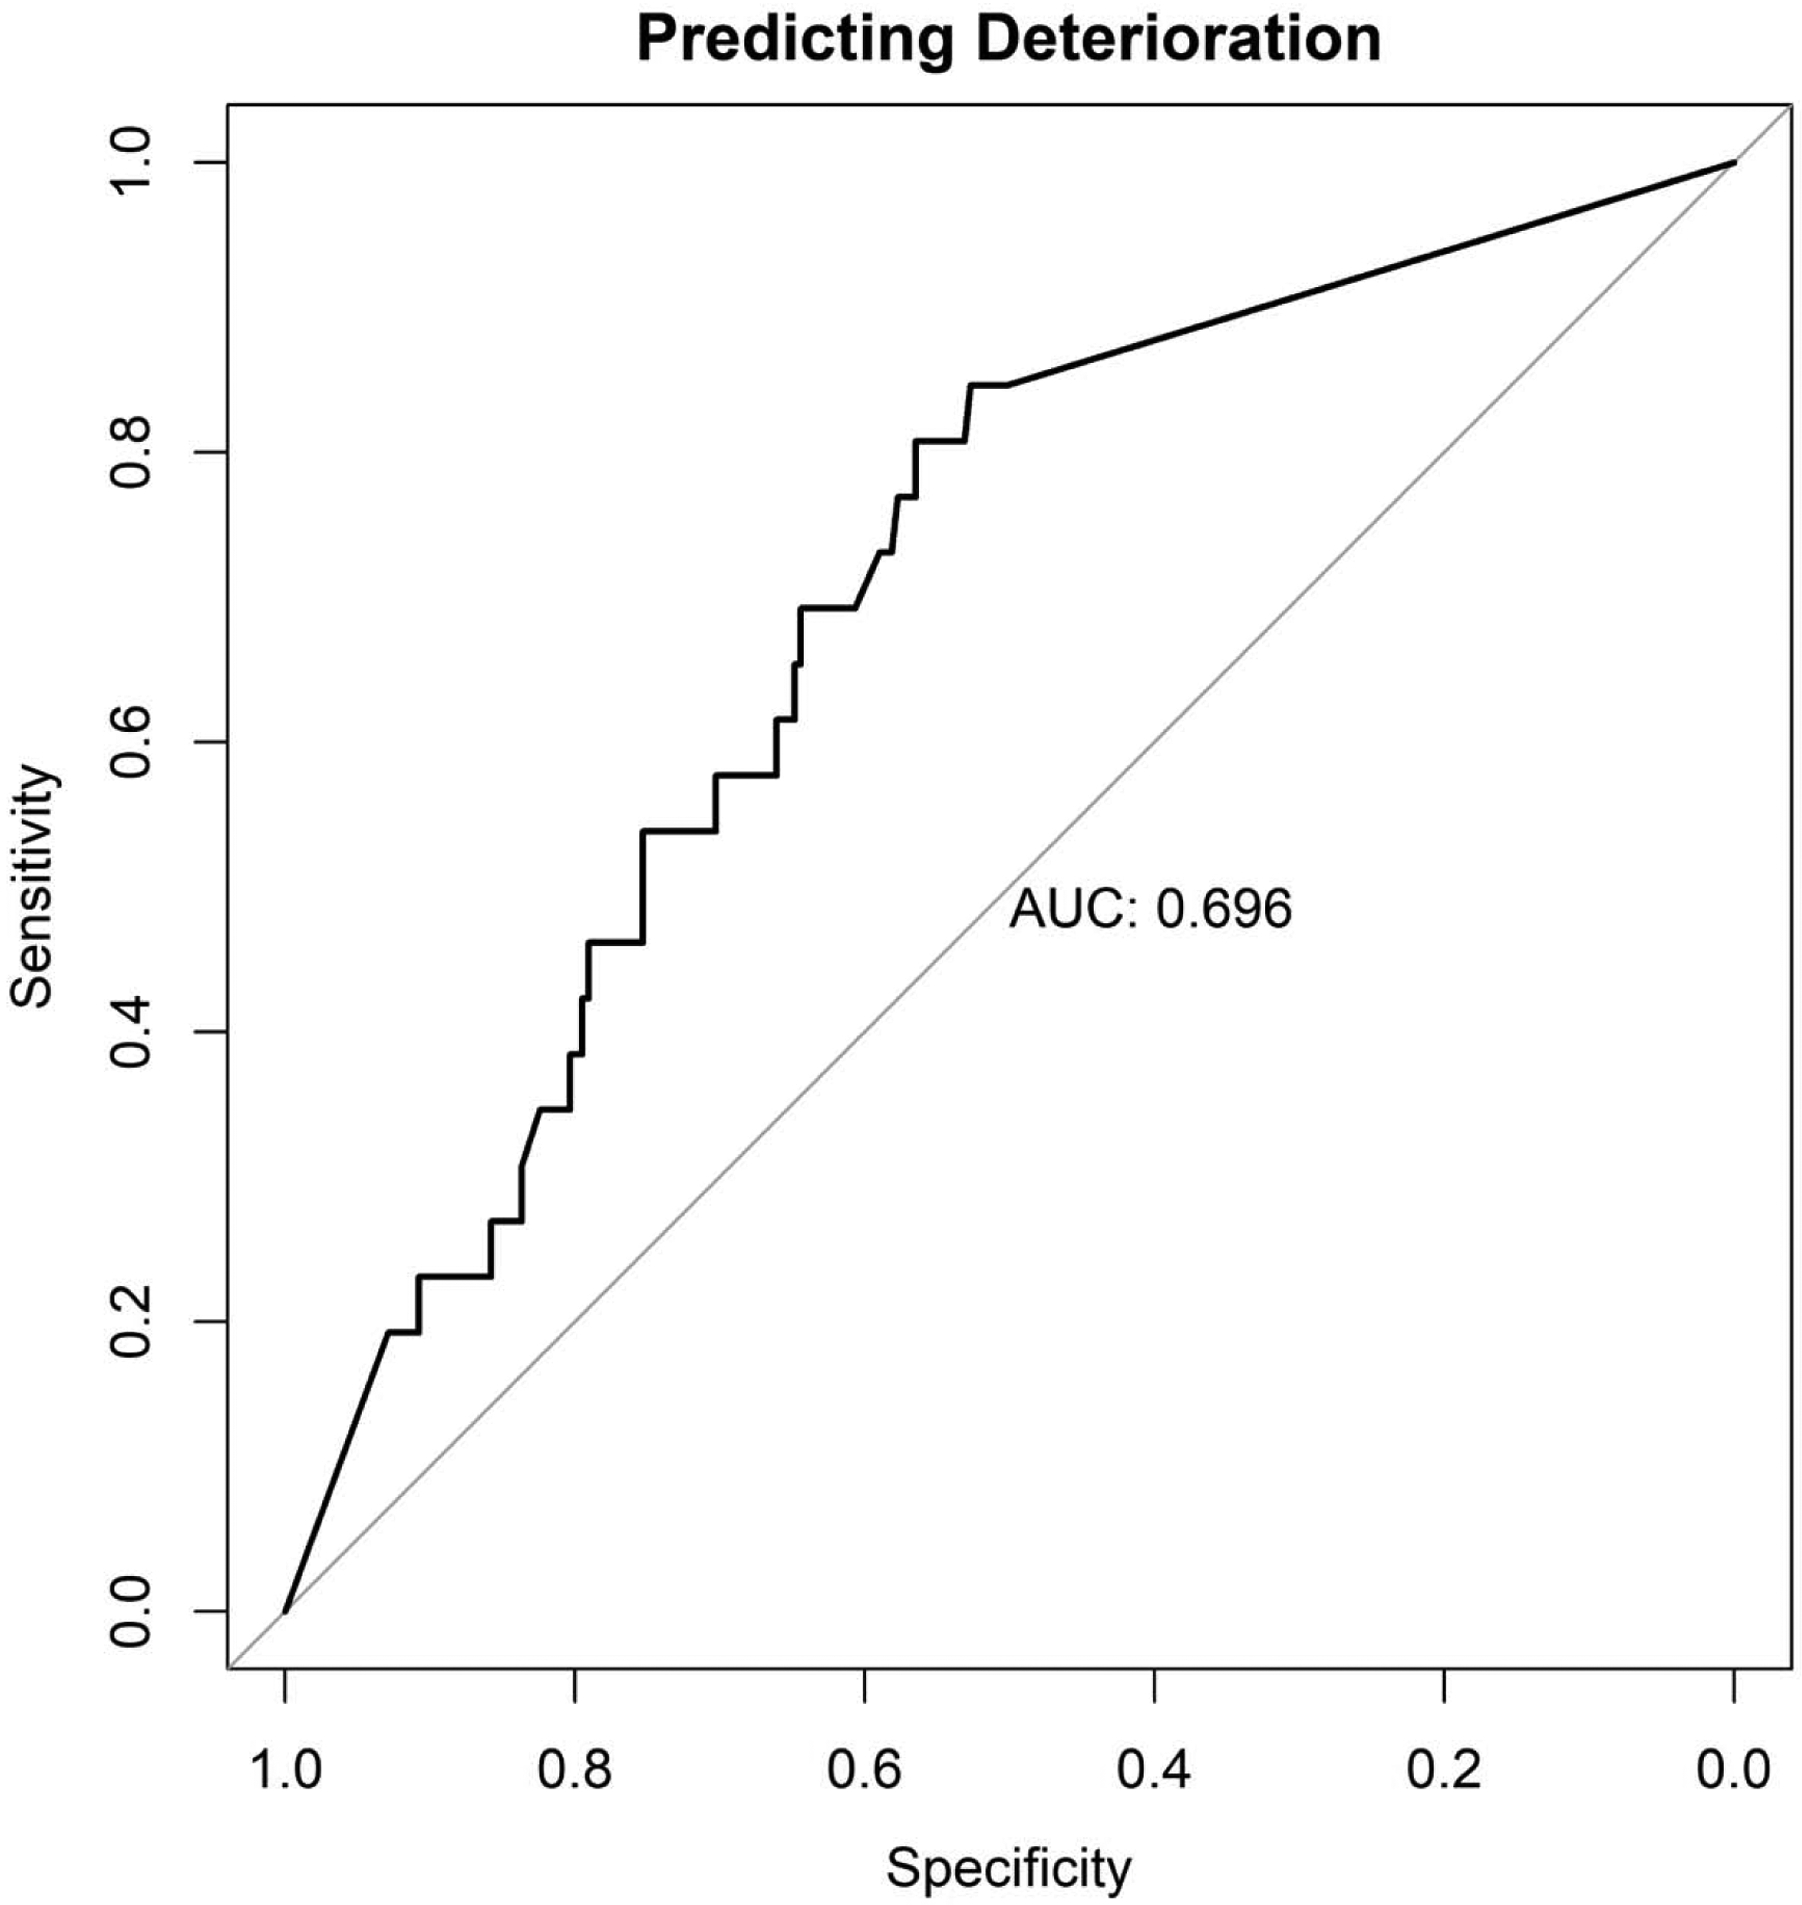
Figure 2.

Plot of machine learning predictive performance with AUC as the primary outcome metric. The curve demonstrates the trade-off in true-positive (sensitivity) and true-negative (specificity) predictive accuracy. Here, an area under the ROC of 0.696 corresponds with an ability to correctly predict deterioration in 84.6% who deteriorate and an ability to correctly predict non-deterioration in 52.7% of individuals who do not deteriorate.
