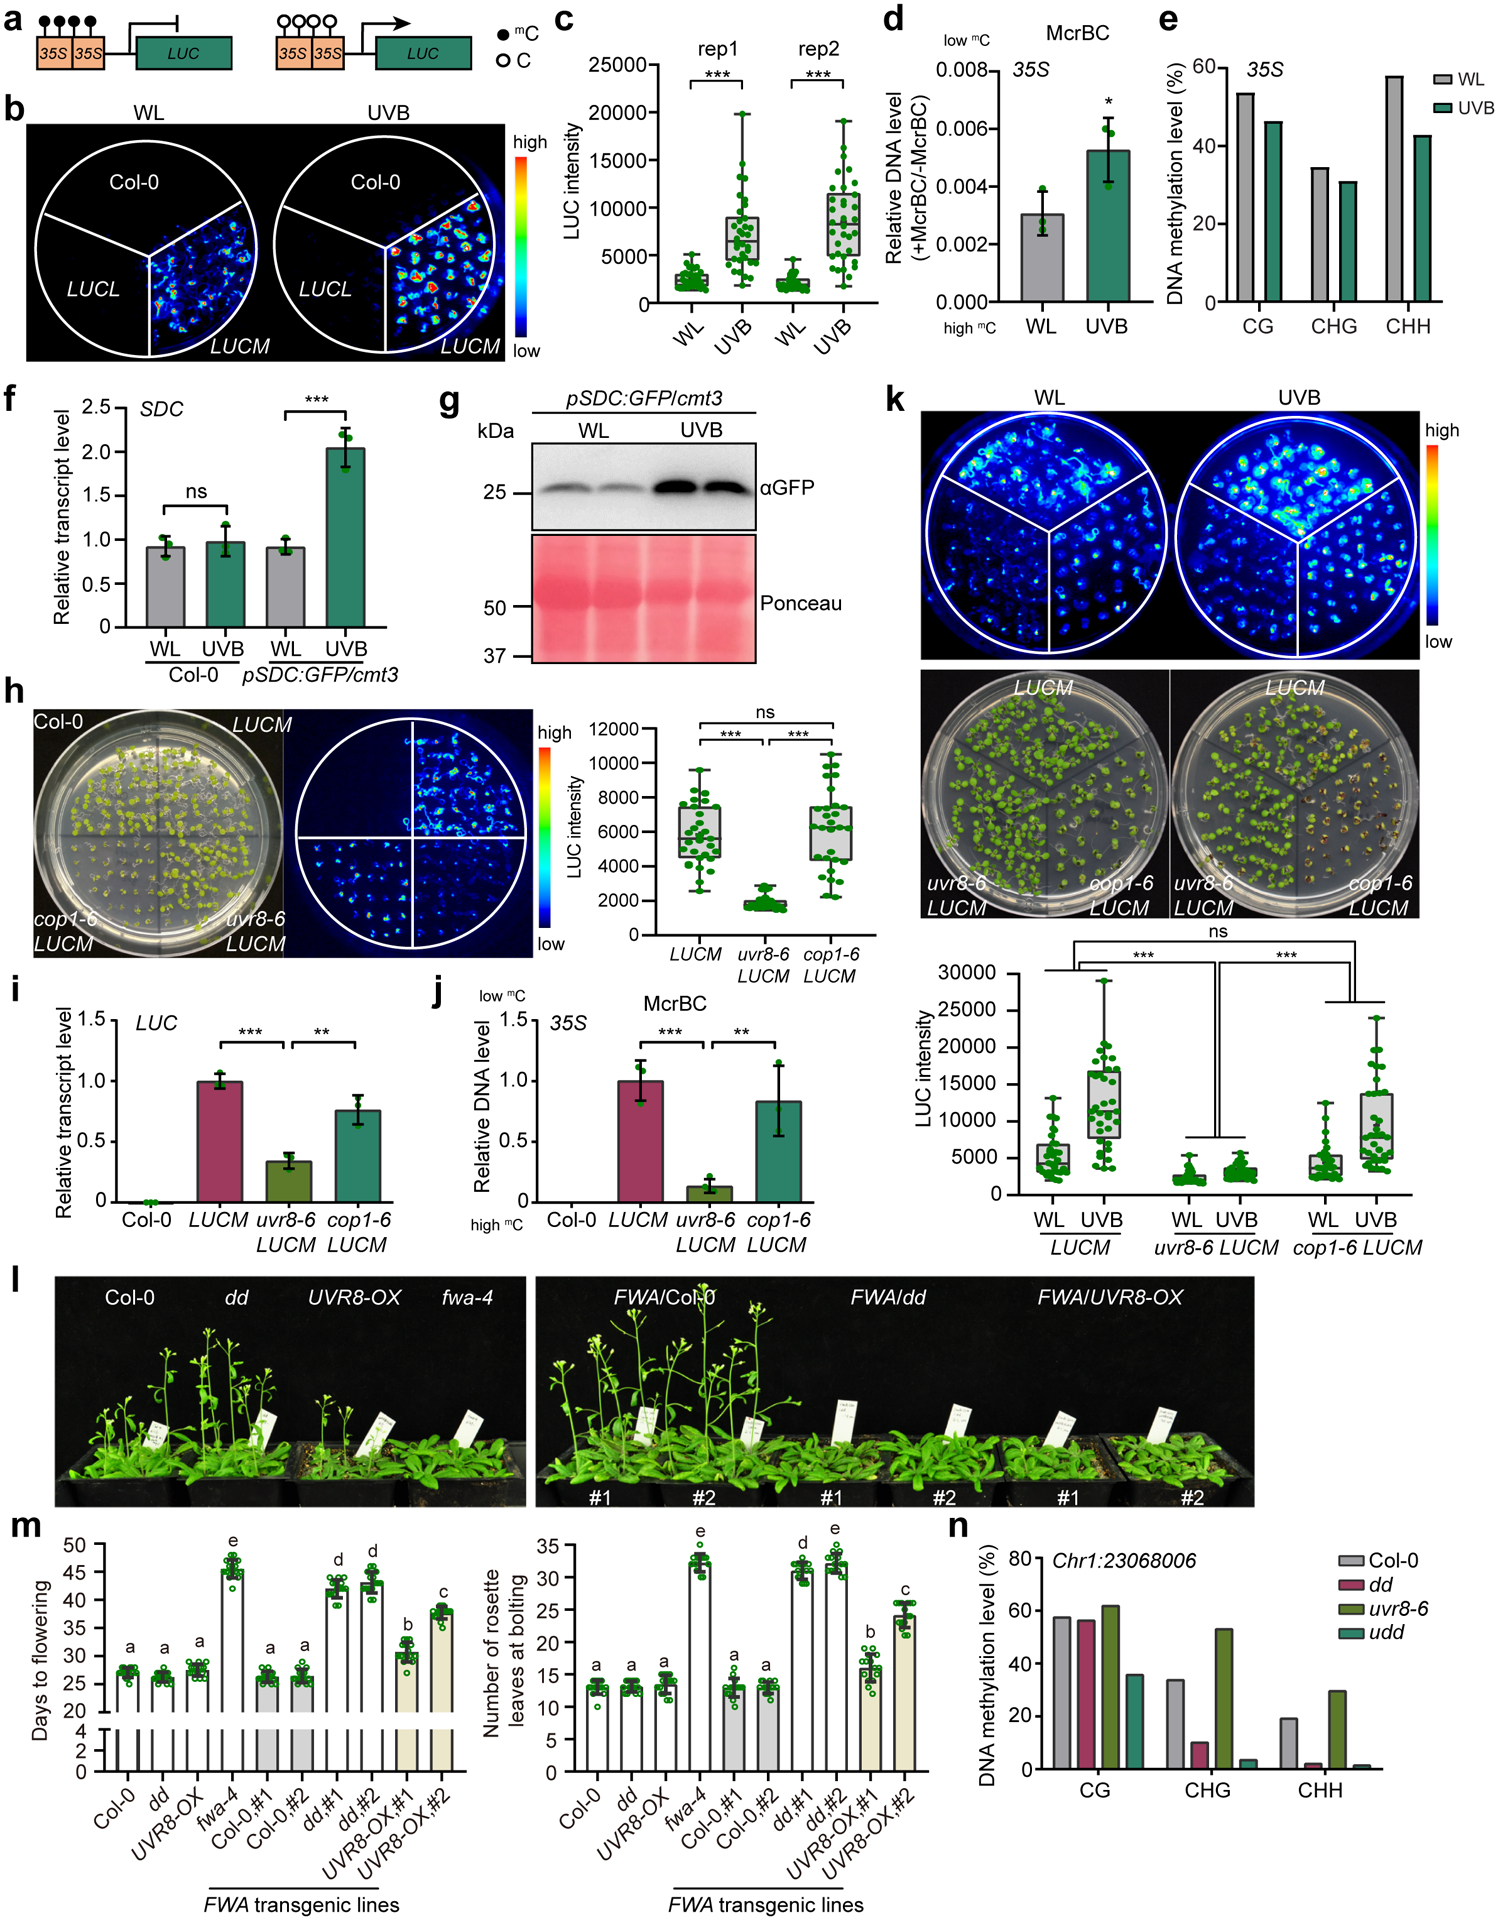
Fig. 1: UVB induces DNA hypomethylation in a UVR8-dependent manner.

a, Schematic diagram showing the d35S:LUC reporter lines. mC and C represent methylated and unmethylated cytosine, respectively. b, Luciferase images of Col-0 and two d35S:LUC reporter lines treated with UVB (~1.5 μE narrowband) for 6 days. LUCL and LUCM are low and medium LUC expressing lines, respectively. WL, white light. c, Quantification of luciferase intensity in (b) from two independent biological replicates. Each dot represents a single plant in each group of experiment. The lower and upper box edges correspond to the first and third quartiles, the horizontal lines indicate the median, and the lower and upper whiskers denote the minimal and maximal value, respectively. d, McrBC-qPCR based DNA methylation assay of 35S promoter regions. Low amplification represents high DNA methylation level. Data is mean ± SD. *, p<0.05 by Student’s t-test. e, Bisulfite sequencing of 35S in LUCM with white light (WL) or UVB treatment (~1.5 μE narrowband) for 6 days. f, Relative RNA transcript level of SDC gene in Col-0 and pSDC:GFP/cmt3 plants grown under white light (WL) and UVB (~1.5 μE narrowband) for 6 days. Data is mean ± SD. ns, not significant; ***, p<0.001 by Student’s t-test. g, Immunoblot of GFP in pSDC:GFP/cmt3 in response to UVB. Ponceau staining serves as a loading control.
h, Luciferase images and quantification of intensity of LUCM in uvr8–6 and cop1–6. Each dot represents a single plant. The lower and upper box edges correspond to the first and third quartiles, the horizontal line indicates the median, and the lower and upper whiskers denote the minimal and maximal value, respectively. ns, not significant; ***, p<0.001 by Student’s t-test. i, Relative RNA transcript level of LUC in samples in (h). Data is mean ± SD. ***, p<0.001; **, p<0.01 by Student’s t-test. j, McrBC-qPCR based DNA methylation assay of 35S promoter regions. Low amplification represents high DNA methylation level. Data is mean ± SD. ***, p<0.001; **, p<0.01 by Student’s t-test. k, Luciferase images and quantification of luciferase intensity of LUCM treated with UVB (~1.5 μE) or white light (WL). The lower and upper box edges correspond to the first and third quartiles; the horizontal lines indicate the median, and the lower and upper whiskers correspond to the minimal and maximal value, respectively. ***, p<0.001 by two-way ANOVA test. l, Phenotypic images of homozygous FWA T3 transgenic lines in indicated background. The non-transformed plants serve as controls. dd, drm1 drm2; fwa-4, an epiallele mutant of FWA; UVR8-OX, a homozygous 35S:UVR8-FLAG overexpressing line. m, Quantification of flowering time of FWA transgenic plants determined by days to flowering (left panel) and number of rosette leaves at bolting (right panel). Each dot represents a single plant. Data is mean ± SEM. Different letters represent significant differences (p<0.05 by Student’s t-test) between samples. n, Bisulfite sequencing of Chr1:23068006 locus (Chr1:23068006–23068366). dd, drm1 drm2; udd, uvr8–6 drm1 drm2.
