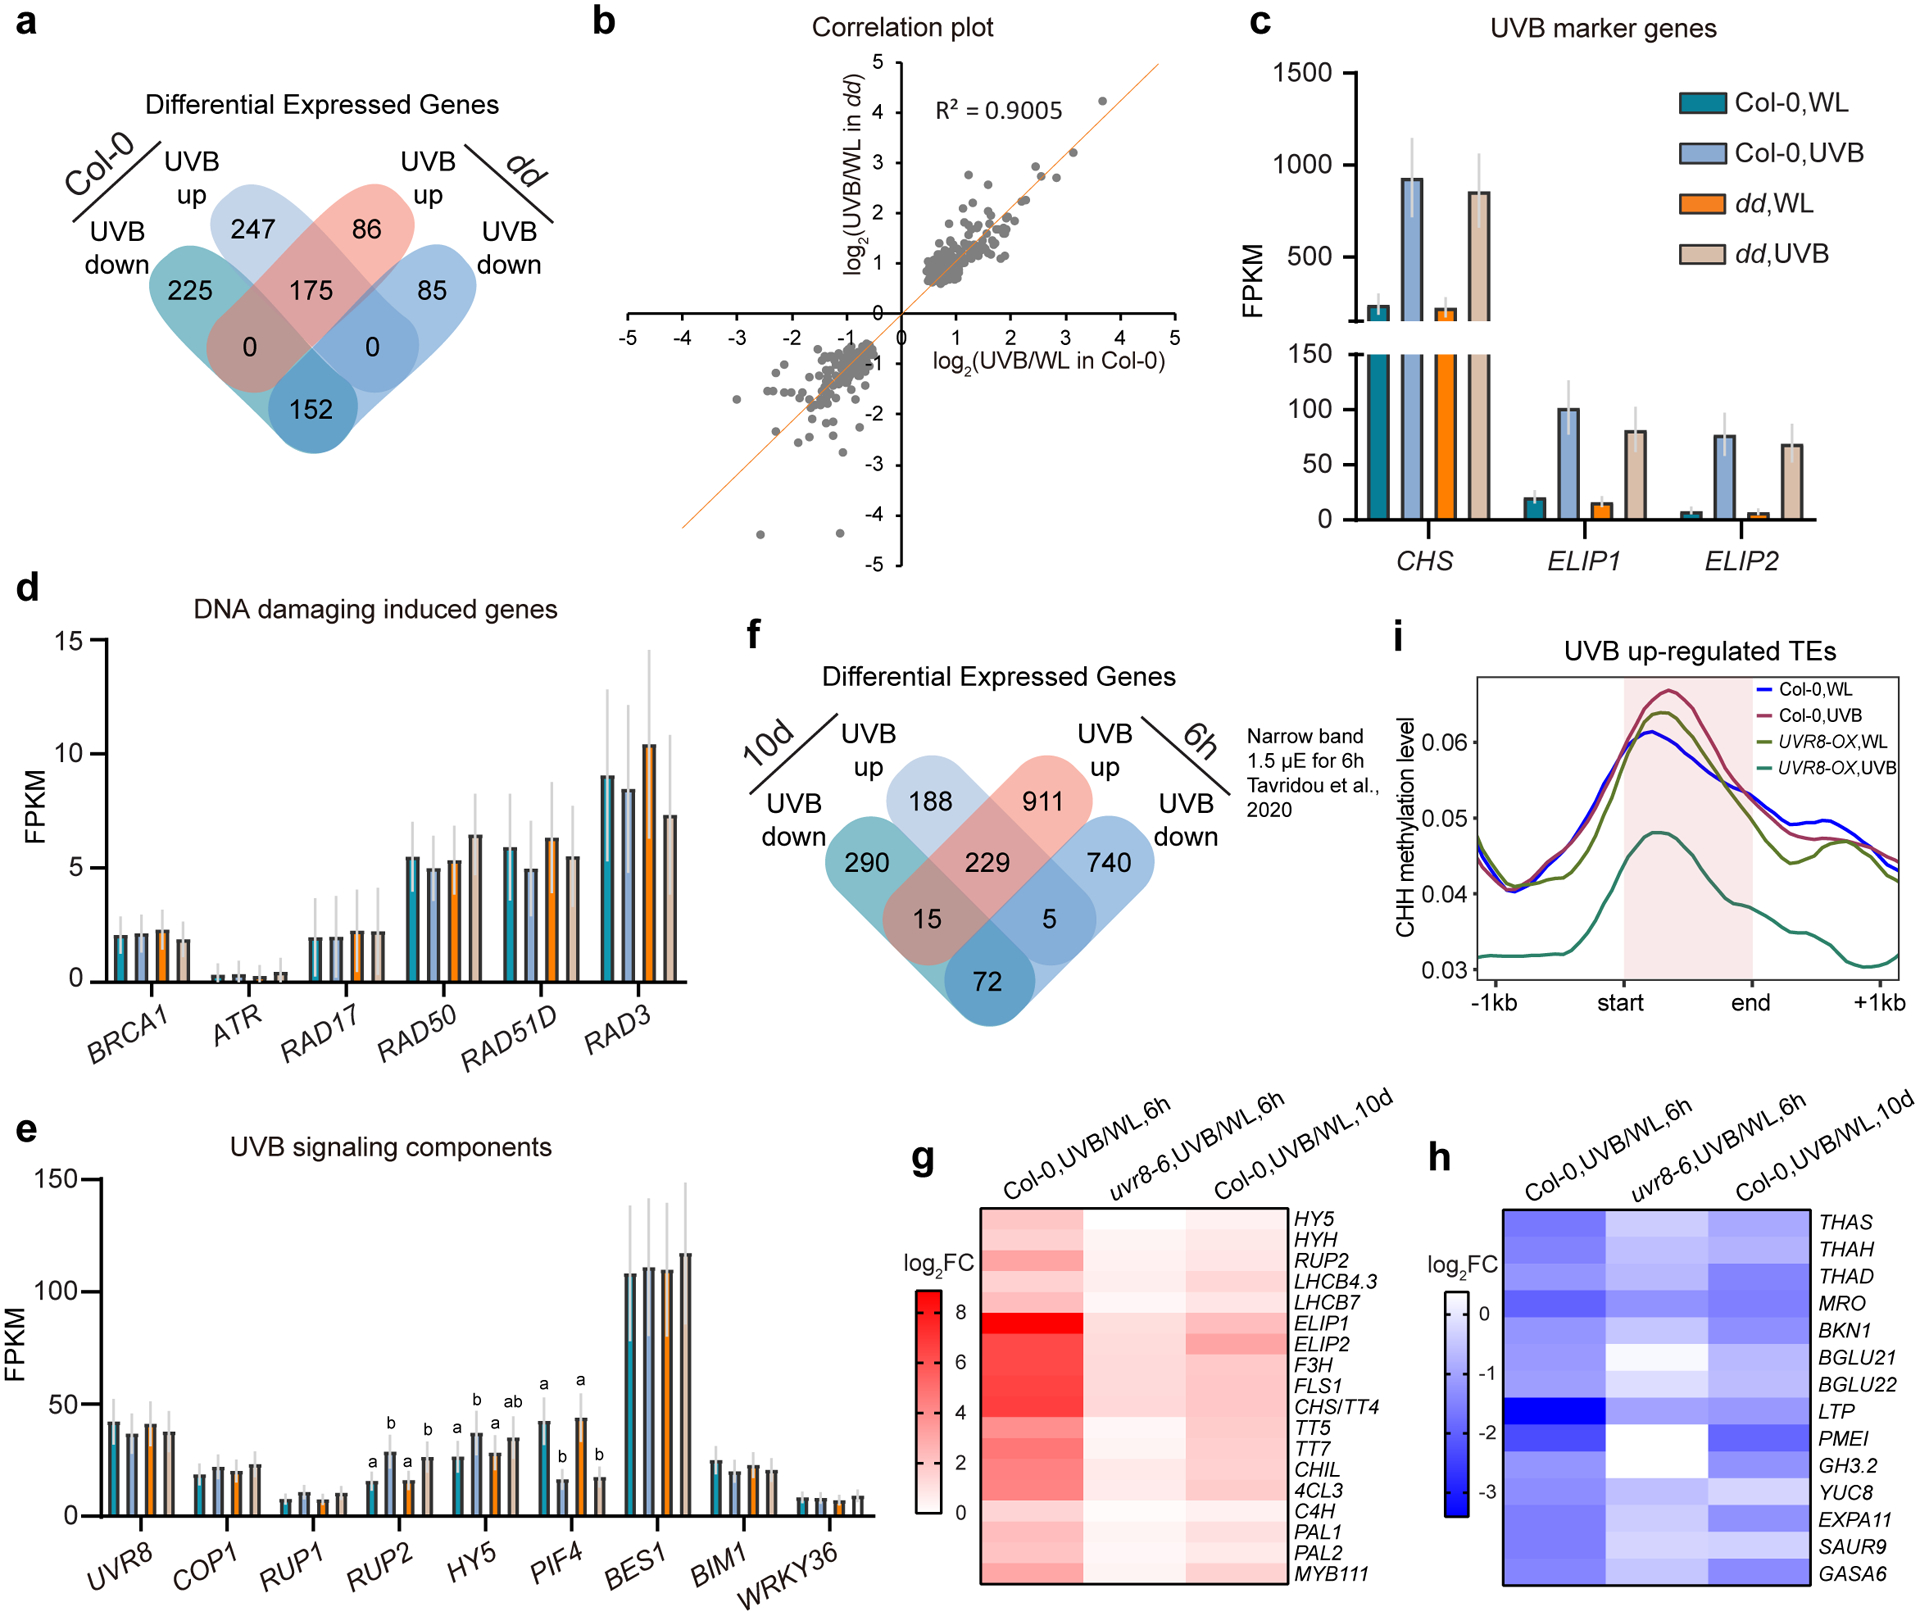
Extended Data Fig. 5. Differential expressed genes (DEG) induced by UVB.

a, Venn diagram showing the overlapping of DEGs induced by UVB in Col-0 and drm1 drm2 (dd). b, Correlation plot showing the expression level change (log2FC) of common UVB-responsive DEGs in Col-0 and dd (n=327). c, Expression levels of marker genes, which are up-regulated by UVB, in Col-0 and dd. Data is mean with 95% confidence interval. d, Expression levels of DNA-damaging induced genes in Col-0 and dd. Data is mean with 95% confidence interval. e, Expression levels of genes in UVB-signaling pathway. Data is mean with 95% confidence interval. Different letters denote significant differences (p<0.05 by Student’s t-test) among samples. f, Venn diagram showing the overlapping of DEGs induced by long-term (10d, this study) and short-term (6h, ref80) UVB treatment in Col-0. g and h, Heat map showing the expression of several UVB up-regulated (g) and down-regulated (h) DEGs in both long-term and short-term UVB treatment. i, Metaplots showing the CHH methylation level of UVB up-regulated TEs (n=269). Data of 1 kb upstream and downstream of the TE body are shown.
