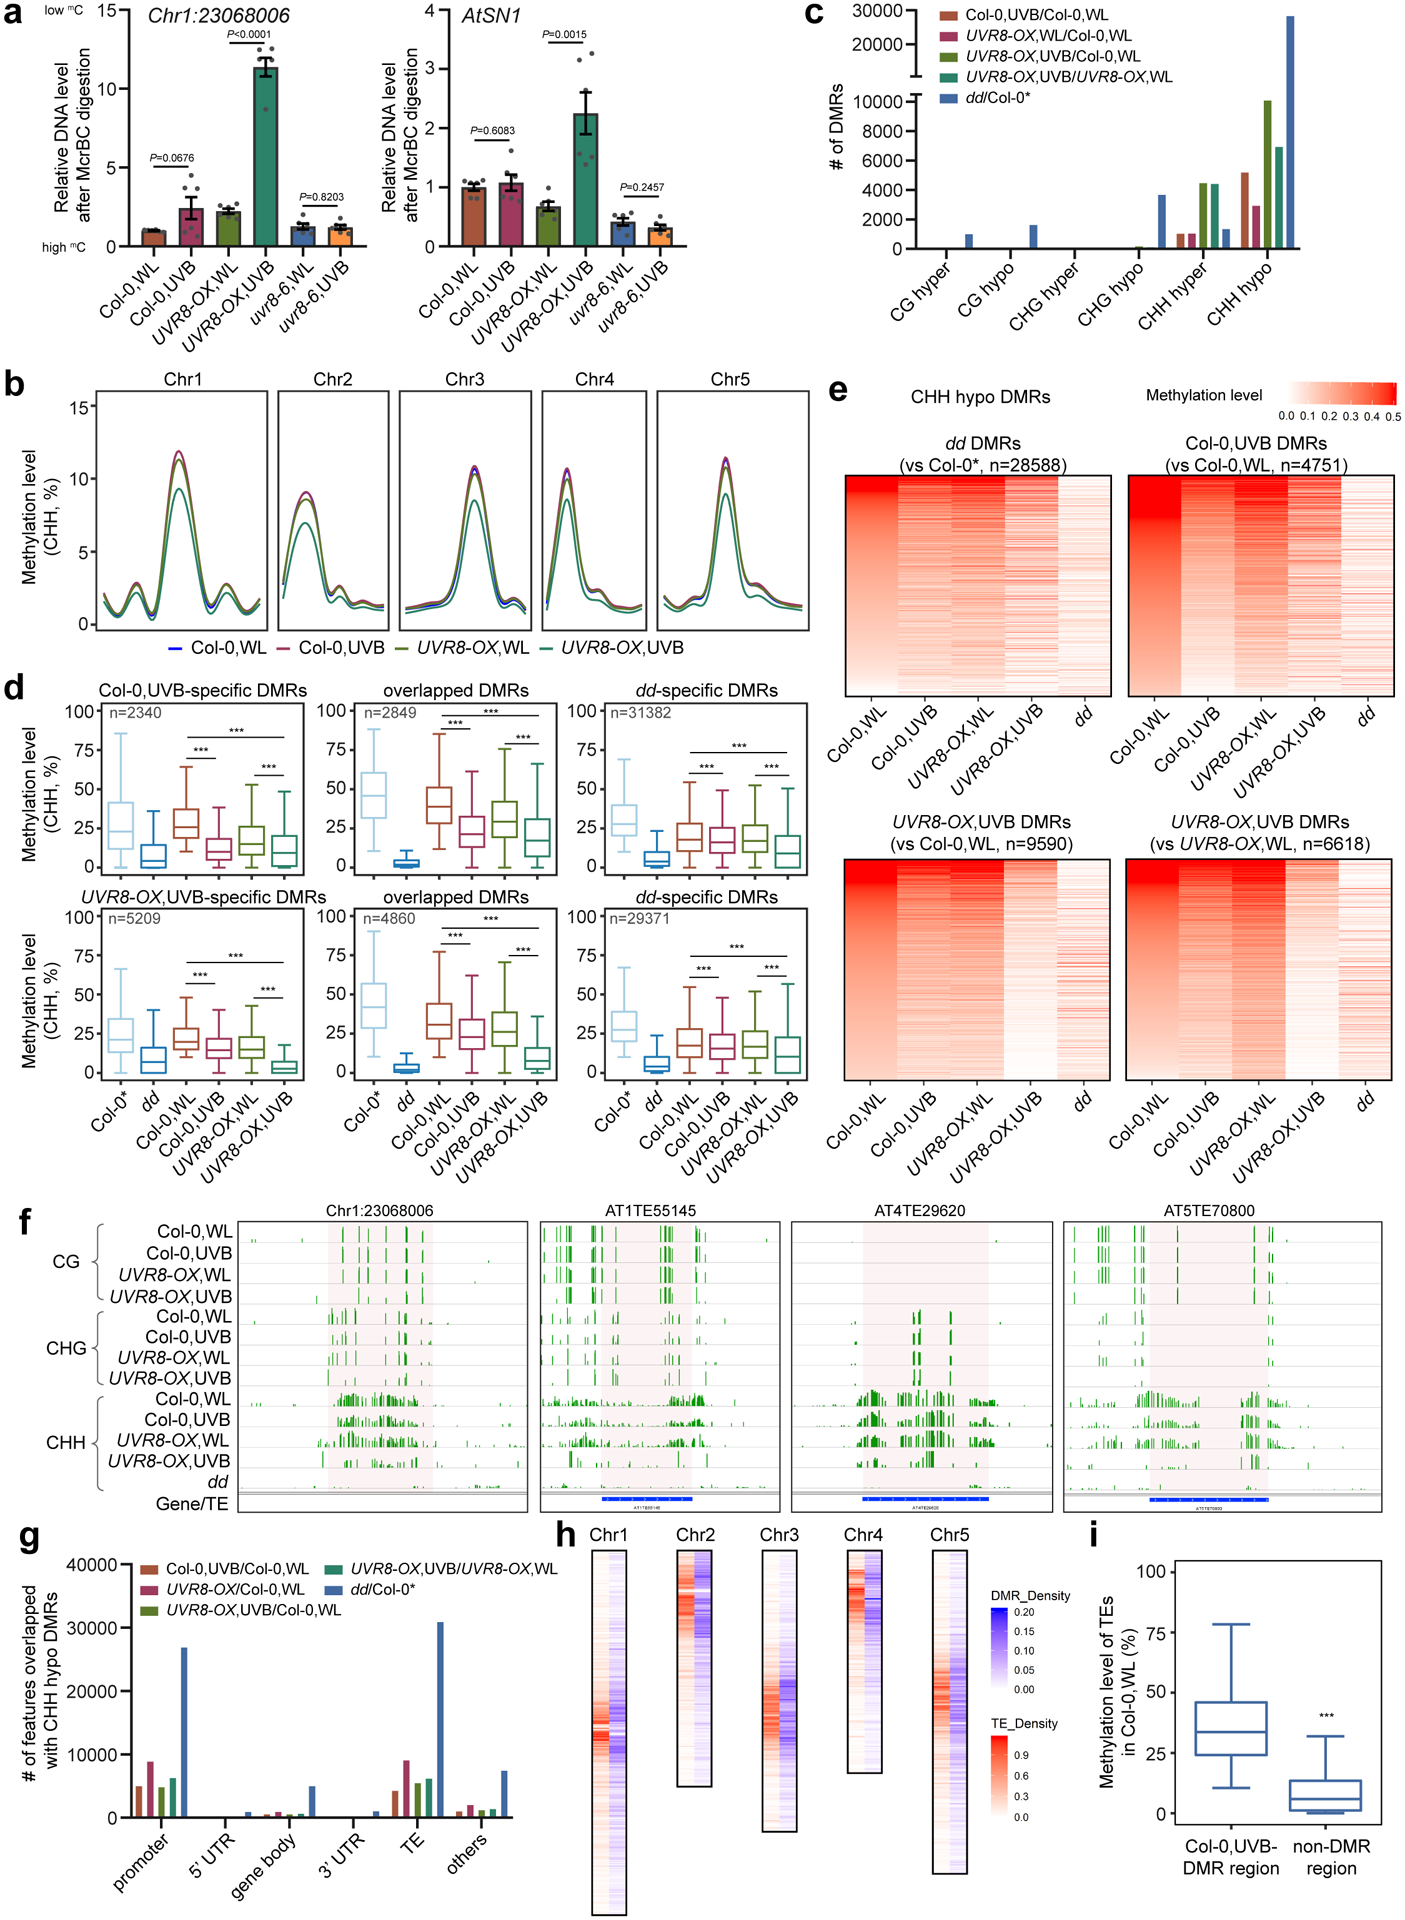
Fig. 2: UVB induces genome-wide CHH hypomethylation.

a, McrBC-qPCR based DNA methylation assay of Chr1:23068006 and AtSN1 in Col-0, UVR8-OX, and uvr8–6 plants with white light (WL) or UVB treatment (1.5 μE for 10 days). Data is mean ± SEM from two biological replicates with three technical replicates. The P values by Student’s t-test were shown. b, Metaplots showing average CHH methylation levels in Col-0 and UVR8-OX plants with or without UVB treatment. Chr1 to Chr5 represent five chromosomes.
c, Numbers of differential methylation regions (DMRs) in context of CG, CHG, and CHH. Col-0* is the control for drm1 drm2 (dd) from ref78. d, Boxplots of CHH methylation levels of UVB-specific, overlapping, and dd-specific DMRs in different samples. The number of DMRs were indicated as ‘n’. The DMRs are the overlapping between Col-0,UVB-DMRs (upper panel) or UVR8-OX,UVB-DMRs (lower panel) against Col-0 dd-DMRs. The lower and upper box edges correspond to the first and third quartiles, the horizontal lines indicate the median, and the lower and upper whiskers denote the smallest and largest value at most 1.5× IQR, respectively. ***, p < 0.001, by nonparametric Mann-Whitney-Wilcoxon test. e, Heat-maps showing the CHH methylation levels of different samples in the regions corresponding to the indicated DMRs. f, Representative snapshots of UVB-induced CHH hypomethylation regions. The data range is [0,1]. g, The distribution of CHH hypo DMRs in the genome. h, The density of Col-0,UVB-CHH hypo DMRs and TEs on chromosomes. The density is the proportion of DMRs or TEs in a 100kb window. i, CHH methylation levels of TE with or without UVB-induced CHH hypo DMRs. The lower and upper box edges correspond to the first and third quartiles, the horizontal lines indicate the median, and the lower and upper whiskers denote the smallest and largest value at most 1.5× IQR, respectively. ***, p < 0.001, by nonparametric Mann-Whitney-Wilcoxon test.
