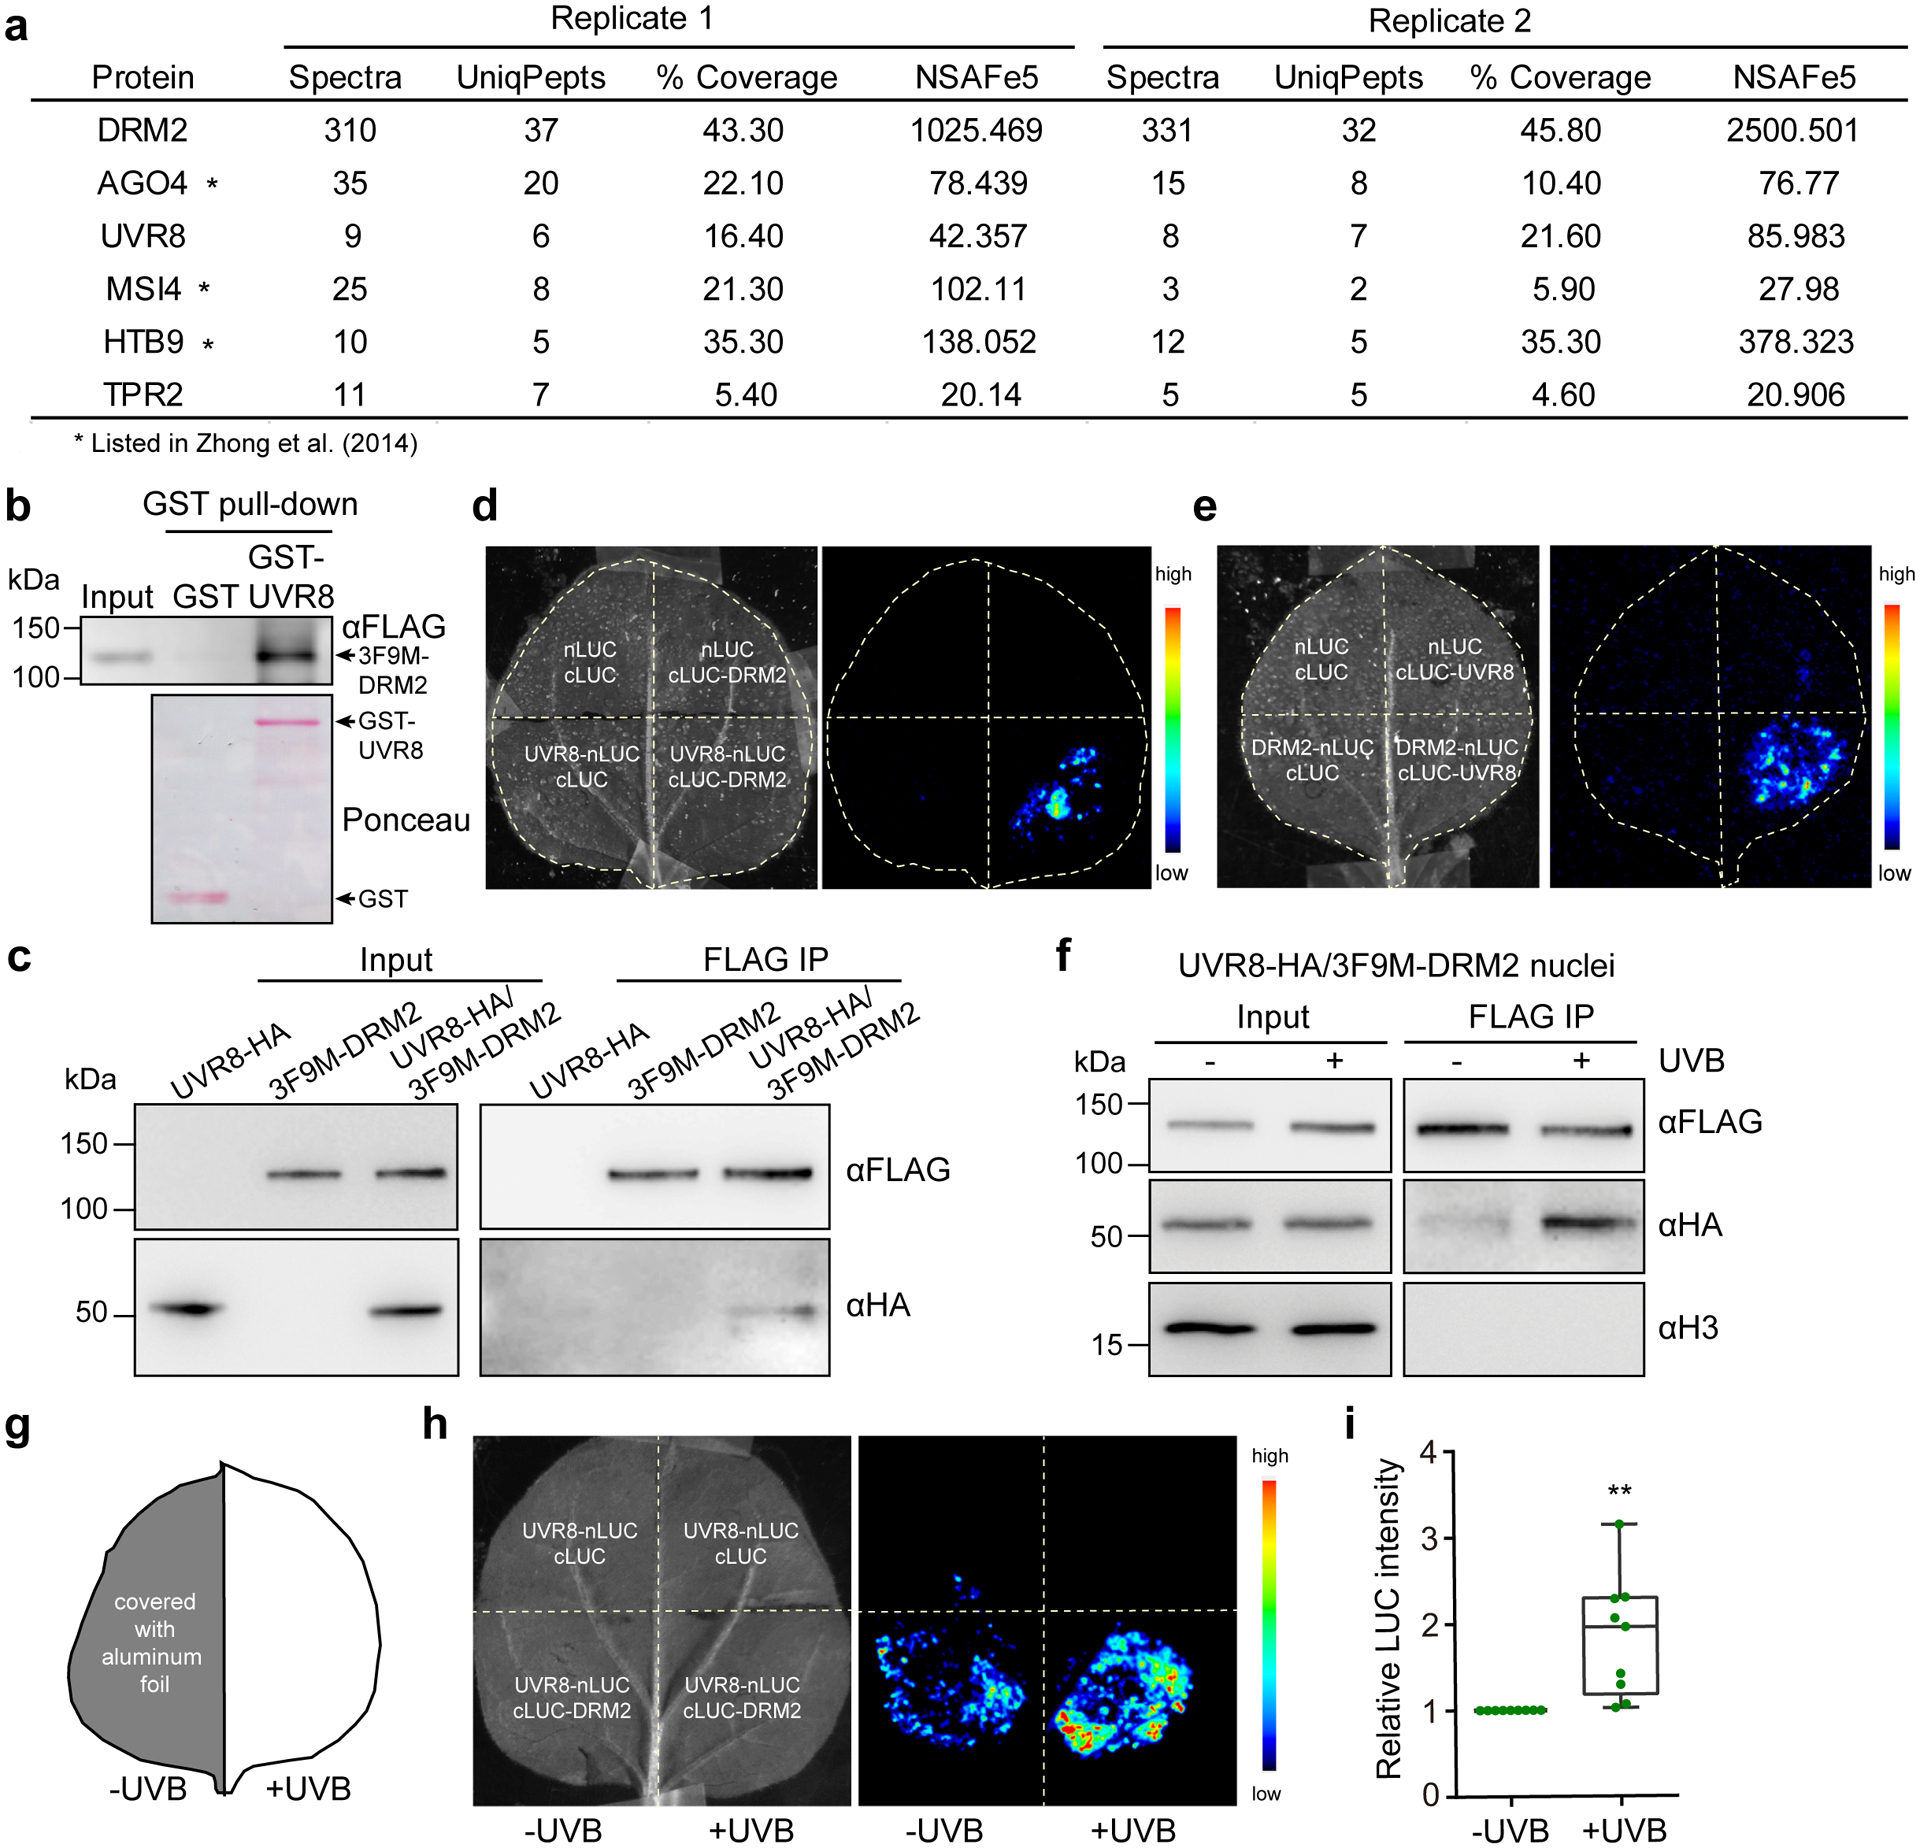
Fig. 4: DRM2 interacts with UVR8 in vitro and in vivo.

a, List of partial proteins co-purified with DRM2 (original data in ref34). “UniqPepts” indicates the number of unique peptides that are mapped to one single protein; “%Coverage” indicates the percentage of the protein covered by unique peptides; NSAFe5 indicates normalized spectral abundance factor. Full list is included in Supplementary Dataset 1. b, GST pull-down assay using GST-UVR8 purified from E. coli and DRM2 purified from 3F9M-DRM2 transgenic plants.
c, Co-immunoprecipitation of UVR8 and DRM2 with FLAG beads using nuclei isolated from 10-d old Arabidopsis seedlings expressing UVR8-HA and/or DRM2-FLAG. d and e, Split luciferase assay in N. benthamiana leaves co-expressing the indicated constructs. UVR8-nLuc and cLuc-DRM2 (d) or cLuc-UVR8 and DRM2-nLuc (e) were co-expressed in N. benthamiana leaves and imaged after spraying with luciferin. nLuc- and cLuc-only vectors serve as negative controls. f, Co-immunoprecipitation of UVR8 and DRM2 using nuclei isolated from 10-d-old UVR8-HA/3F9M-DRM2 Arabidopsis seedlings treated with or without ~1.5 μE UVB for 4 hours. Histone H3 serves as a nuclear marker. g, Diagram showing the UVB treatment in split luciferase assay. ‘+UVB’ indicates the half leaf with 30 minutes of UVB treatment under broadband UVB fluorescent lamp. ‘ -UVB’ indicates the half leaf covered with aluminum foil. h, Split luciferase assay showing that UVB enhances UVR8-DRM2 interaction. i, Quantification of the luciferase signal in (h). The LUC signals are normalized to -UVB control in each biological replicate. Each dot represents a single biological replicate. Data from nine biological replicates were shown. The lower and upper box edges correspond to the first and third quartiles, the horizontal line indicates the median, and the lower and upper whiskers correspond to the minimal and maximal value, respectively. **, p<0.01 by student’s t-test.
