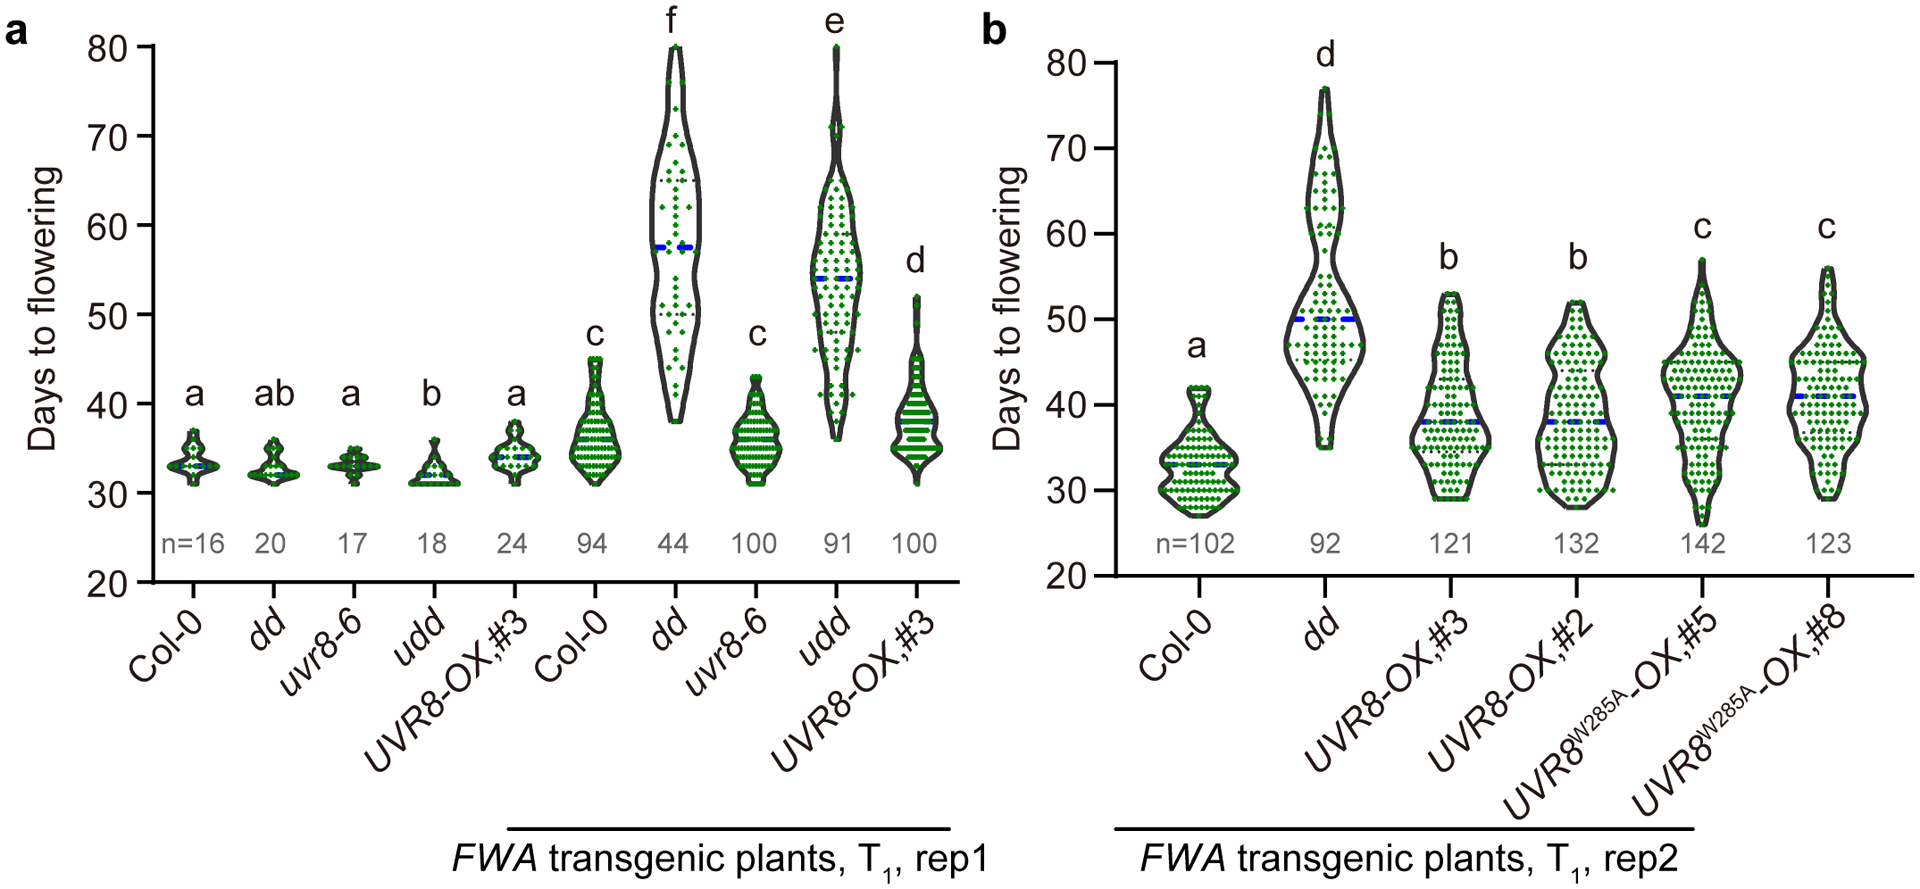
Extended Data Fig. 2. Flowering phenotypes of FWA transgenic plants.

a and b, The flowering time of FWA transgenic T1 plants from two replicates with replicate 1 in (a) and replicate 2 in (b). Indicated genotypes were transformed with FWA transgene and the flowering time of positive Basta-resistant T1 transformants were counted. The non-transformed plants serve as controls. The number of plants is indicated by n. dd, drm1 drm2; udd, uvr8–6 drm1 drm2; UVR8-OX, 35S:UVR8-FLAG overexpression lines (#3 and #2); UVR8W285A-OX, 35S:UVR8W285A-FLAG overexpression lines (#5 and #8). The blue dash line indicates median. Each dot represents a single plant. Significantly different (p<0.05 by Student’s t-test) groups are labelled with different letters.
