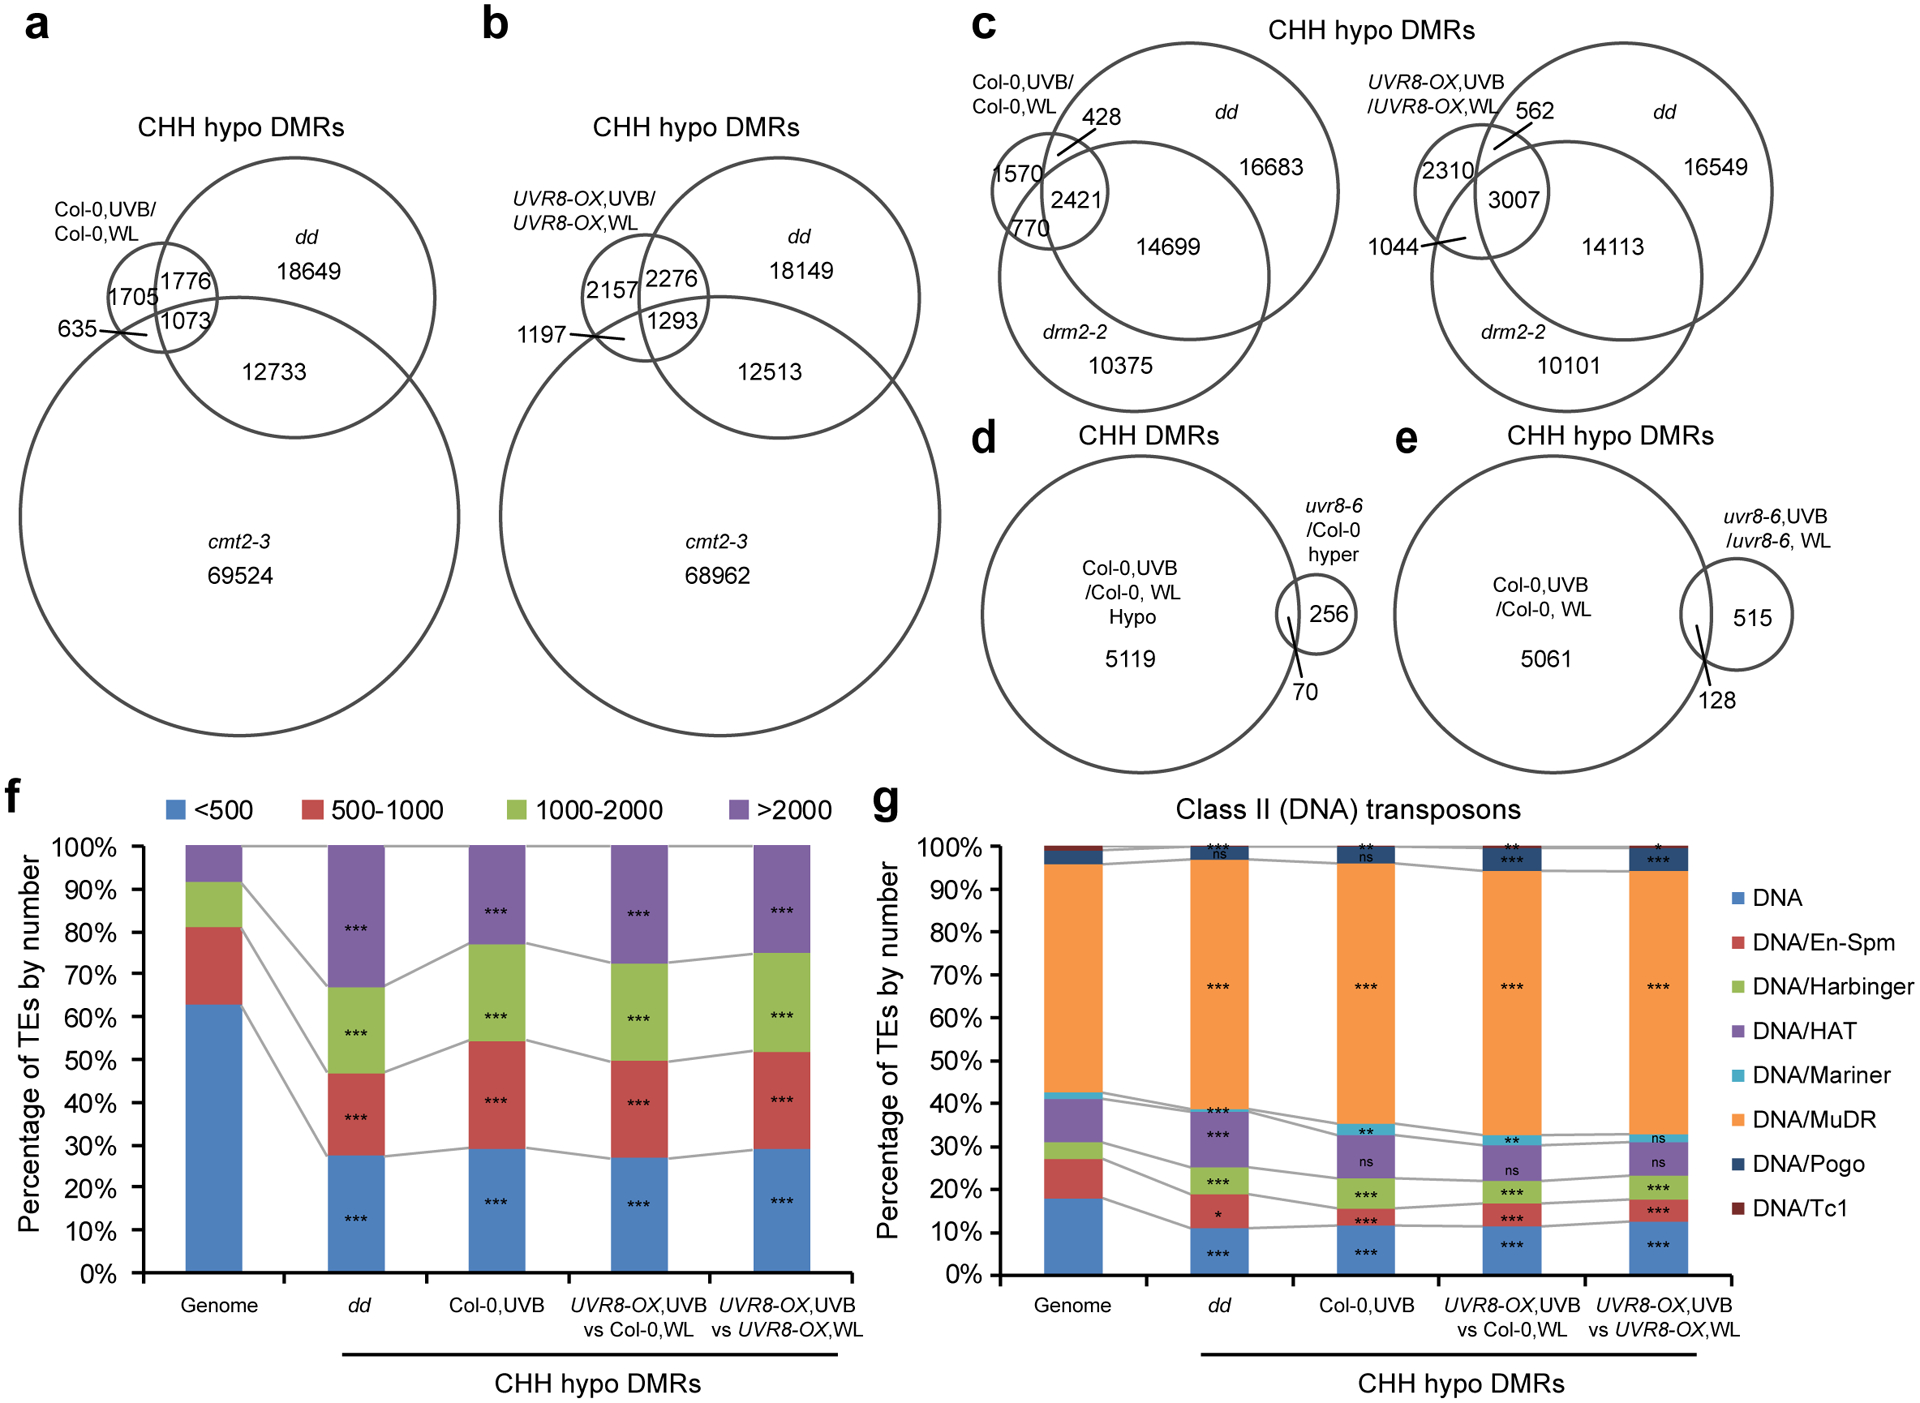
Extended Data Fig. 3. Analysis of UVB-induced differentially methylated regions.

a and b, Venn diagrams showing the overlap of CHH hypo differential methylation regions (DMRs) among drm1 drm2 (dd), cmt2–3, and UVB-induced DMRs in Col-0 (a) and UVR8-OX (b). Data of dd and cmt2–3 are from ref78. c, Venn diagrams showing the overlap of CHH hypo DMRs among UVB-treated Col-0 (left) or UVR8-OX (right), dd, and drm2–2 mutant. Data of drm2–2 is from ref79. d, Venn diagrams showing the overlap of UVB-induced CHH hypo DMRs in Col-0 with hyper DMRs in uvr8–6 mutant. e, Venn diagrams showing the overlap of UVB-induced CHH hypo DMRs in Col-0 and uvr8–6. f, The enrichment of TEs containing CHH hypo DMRs based on length. ***, p<0.001 by Fisher’s exact test. g, The enrichment of Class II (DNA) TEs containing CHH hypo DMRs. ***, p<0.001; **, p<0.01; *, p<0.05; ns, not significant by Fisher’s exact test.
