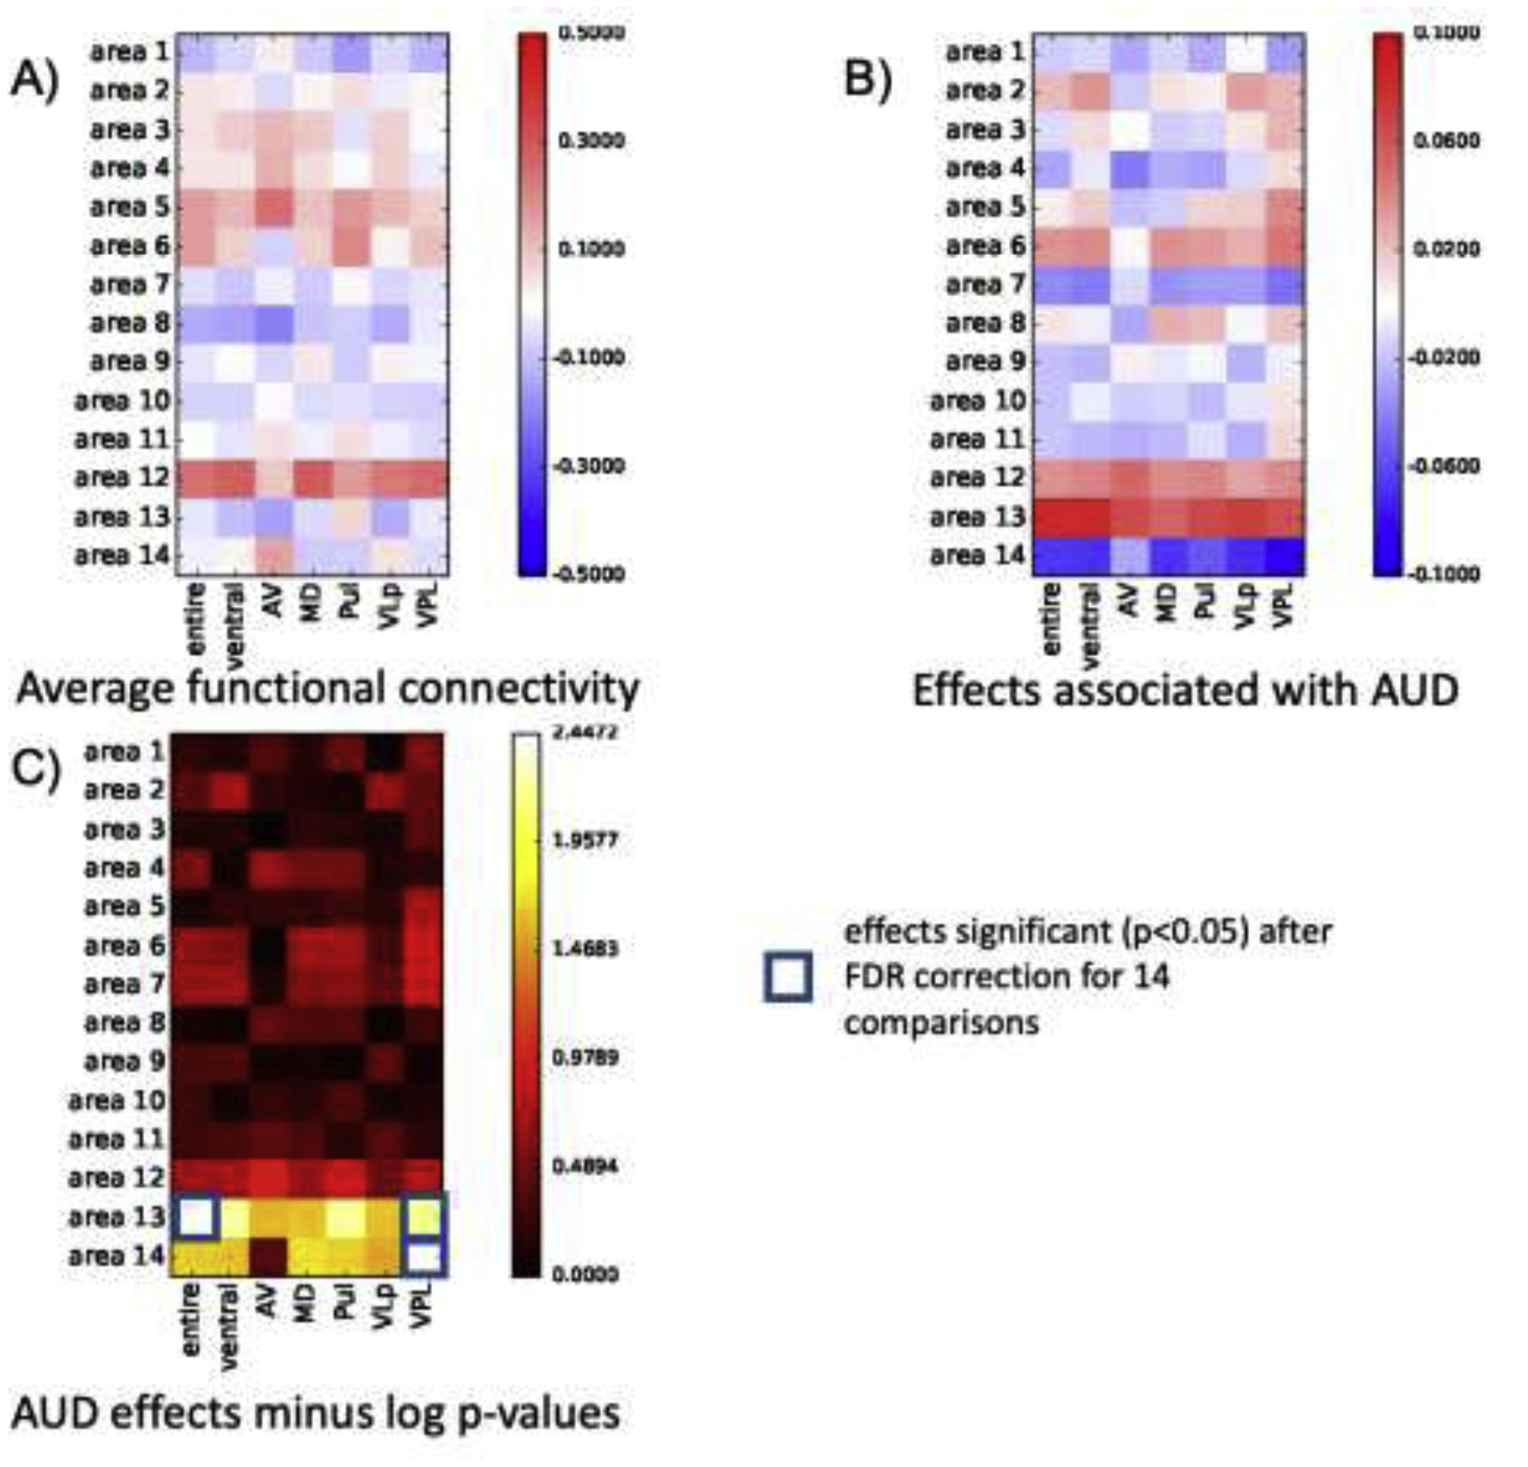
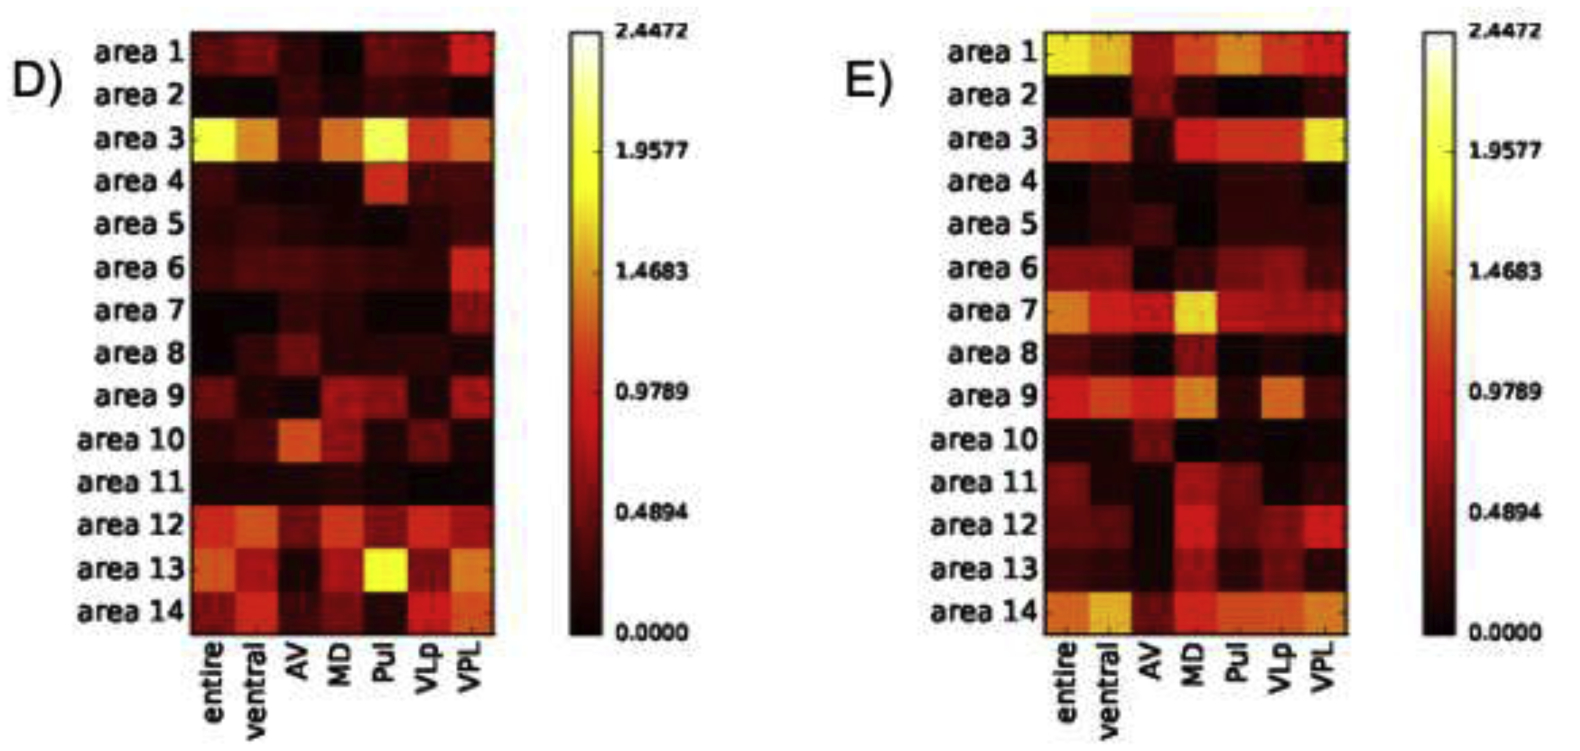
Figure 2.


A) Population average (AUD + control participants) connectivity between thalamic structures and 14 functional regions; red=correlated, blue=anticorrelated. B) Coefficients of linear regression accounting for AUD effects on connectivity between thalamic structures and 14 functional regions; significant AUD effects surviving FDR correction requiring p=.00357 (p=.05/14 regions) are highlighted in C) presenting only AUD effects passing FDR correction for 14 regions. Population average (AUD + control participants) connectivity between thalamic structures and 14 functional regions as a function of D) age and E) sex. Neither age nor sex significantly affected connectivity.
