
Figure 3. KIF18A depletion impairs the mitotic fidelity of WGD+ cells.
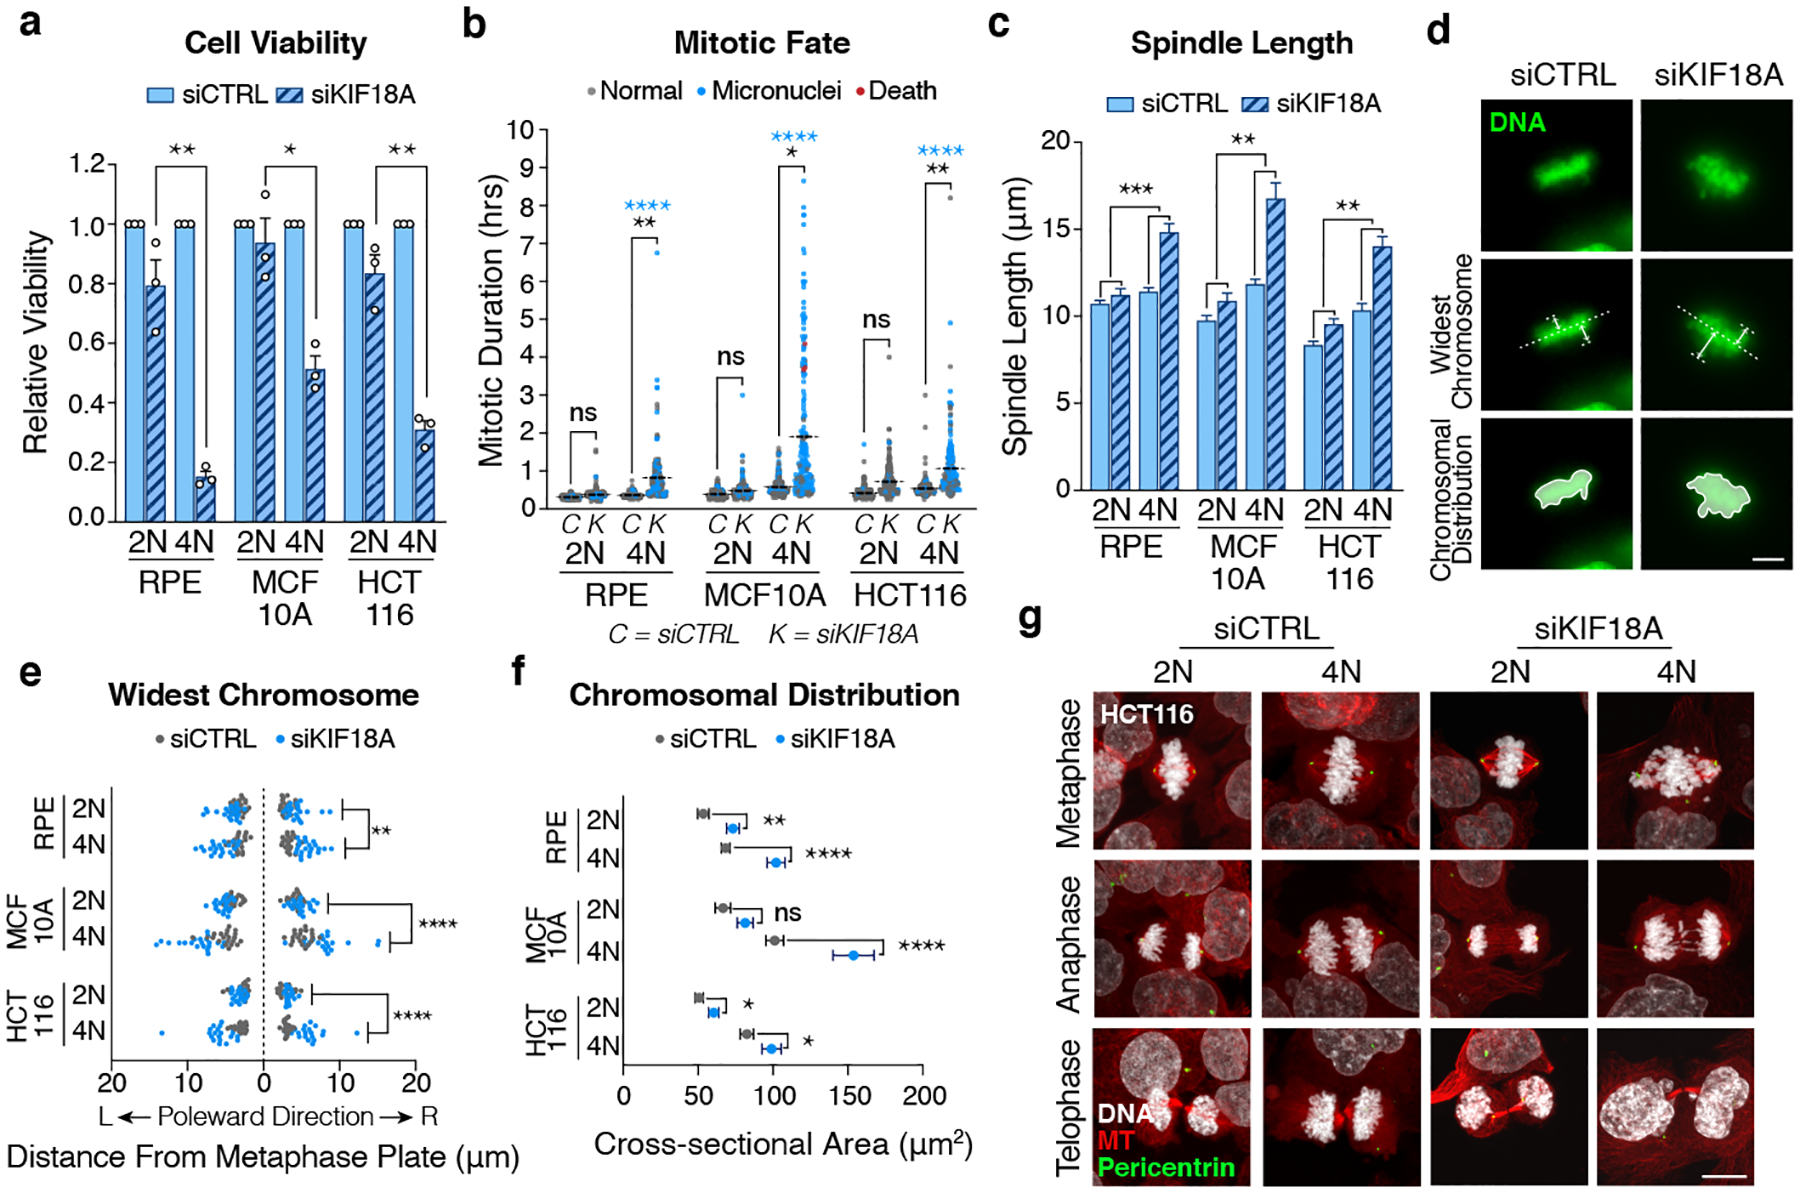
(a) Relative viability of indicated cell lines 8 days after transfection with the indicated siRNAs (n = 3 independent experiments; each condition normalized to respective control; Student’s unpaired t-test – two-sided; graph shows mean +/− SEM; p-values = 0.0019, 0.0109, 0.0017, respectively). (b) Mitotic duration and fate after treatment with indicated siRNA (n = 200 cells per condition; black stars indicate p-value for two-sided Student’s t-test comparing mean mitotic duration; blue stars indicate p-value for two-sided Fisher’s exact test comparing the fraction of mitoses that give rise to micronuclei; dotted line represents mean mitotic duration). (c) Measurement of spindle length (centrosome-to-centrosome) after transfection with indicated siRNA (n = 20 cells per condition; two-way ANOVA with interaction; graph shows mean +/− SEM; scale bar 10 μm; interaction p-values = 0.0001, 0.0011, 0.0032, respectively). (d) Image demonstrating measurement of chromosome oscillations immediately prior to anaphase by assessing the widest oscillating chromosomes in each poleward direction and the cross-sectional area of all the chromosomes (scale bar 10 μm). (e) Widest oscillating chromosome in each poleward direction immediately prior to anaphase (n = 20 cells per condition from 2 independent experiments; two-way ANOVA with interaction; interaction p-values = 0.0025, <0.0001, <0.0001, respectively). (f) Two-dimensional cross-sectional area of the entire body of chromosomes immediately prior to anaphase (n = 20 cells per condition; Student’s unpaired t-test – two-sided; graph shows mean +/− SEM; p-values = 0.0012, <0.0001, 0.0525, 0.0318, <0.0001, 0.0318, 0.0432, respectively). (g) Representative confocal images showing phases of mitosis in indicated cell lines 48 hours after transfection with indicated siRNA (scale bar 10 μm).
* p < 0.05, ** p < 0.01, *** p < 0.001, **** p < 0.0001