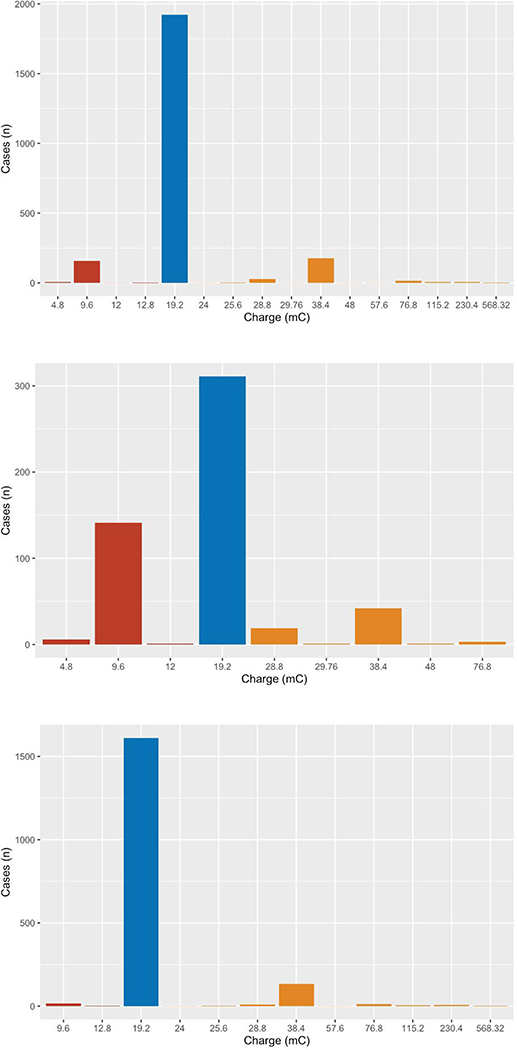
Figure 1:
histogram of energy applied to induce a seizure. Top: overall sample. Middle: sample prior to Oct 2010, when dose titration was determined by the treating psychiatrist. Bottom: sample after October 2010 with a consensus starting dose of 19.2 mC. Charges are binned into less than 19.2 mC (red), 19.2 mC (blue), and greater than 19.2 mC (orange)

