Table 2.
Final consensus (≥80% agreement) terms and definitions to be used in the description of renal masses at CT and MRI. Arrows, solid and dotted lines on figures refer to the relevant term, each of which are defined in the column labeled ‘definition’.
| Category | Term | Level of Agreement for Inclusion |
Level of Agreement for Definition |
Definition | Counterpoints and Other Comments |
|---|---|---|---|---|---|
| Basic imaging terms | Renal mass | 100% | 100% | Any space-occupying abnormality thought to originate from or contiguous with renal parenchyma. Abnormalities include space-occupying features which deviate from the normal appearance of renal parenchyma and surrounding tissues. | One panelist agreed with the proposed definition but also recommended that benign entities with pathognomonic appearance, such as hypertrophic column of Bertin, should not be considered a renal mass. |
| Composition | 100% | 100% | The internal make-up of a renal mass, which may be further categorized as solid or cystic. | ||
Solid mass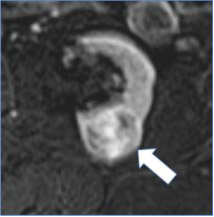
|
100% | 60% | Mass composed of greater than or equal to 25% solid enhancing components or fat. | Four (of 10) panelists commented that solid component does not always enhance and may appear as heterogeneous non-enhancing tissue. | |
Cystic mass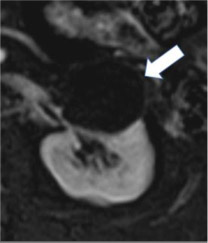
|
100% | 90% | Mass composed of less than 25% enhancing components or fat. | ||
Size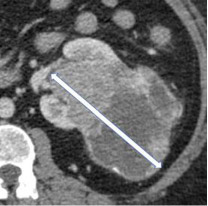
|
100% | 100% | The single longest dimension of a renal mass in any plane. | ||
| Laterality | 100% | 100% | Localization of renal mass(es) in the right, left or bilateral kidneys | ||
| Margin | 100% | 100% | The interface between the mass and adjacent uninvolved tissue. | ||
Well-defined margin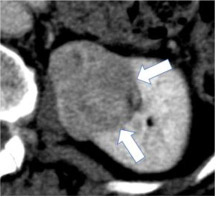
|
100% | 90% | A sharp pencil-thin demarcation between the mass and surrounding tissue over at least 90% circumference of the mass. | One panelist suggested using sharp demarcation over "most of the circumference of the mass" instead of using 90% threshold. | |
Ill-defined margin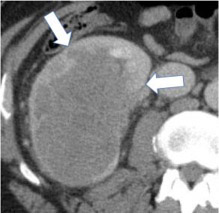
|
100% | 100% | An indistinct or blurred demarcation between the mass and surrounding tissue over greater than 10% circumference of the mass. | ||
| Growth pattern | 100% | 100% | The location of a renal mass relative to the renal parenchymal contour. | ||
| Categories of growth pattern -Endophytic 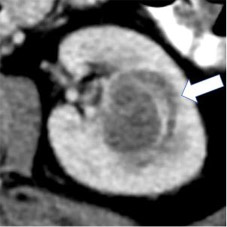 - <50% Exophytic 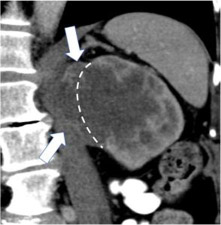 - ≥50% Exophytic 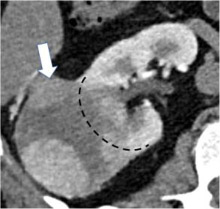
|
100% | 100% | Growth pattern may be categorized into: 1. Endophytic: Located within the renal parenchyma such that the outer renal contour is not altered. 2. <50% Exophytic: The renal contour is altered and <50% of the mass projects out from the renal contour. 3. ≥50% Exophytic: The renal contour is altered and ≥50% of the mass projects out from the renal contour. | ||
| Anteroposterior location - Anterior 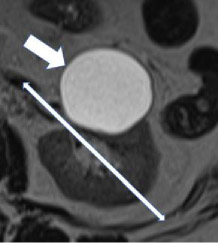 - Posterior 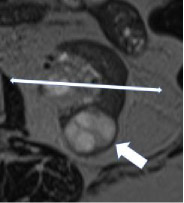
|
100% | 100% | The anterior or posterior location of a mass within the renal parenchyma on axial images. The mass is 'anterior' if the center of the mass lies anterior to the line bisecting the renal hilum on axial images and 'posterior' if the center of the mass lies posterior to this line. | ||
Craniocaudal location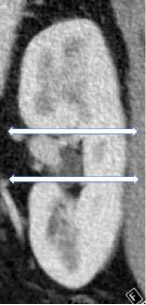
|
100% | 100% | The location of a mass with respect to the polar lines. A renal mass can be centered in the upper pole, interpolar region or lower pole. | ||
Necrosis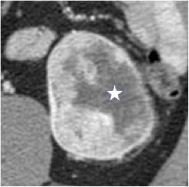
|
100% | 80% | Necrosis is a pathology term and cannot be diagnosed with certainty at imaging; necrosis, fibrosis, and cystic change can appear similar. Necrosis may be considered when non-enhancing ill-defined components of variable CT attenuation or MRI signal intensity are identified. | ||
| CT terms | Attenuation Homogenous mass 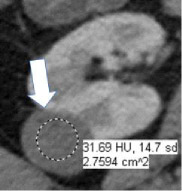 Heterogenous mass 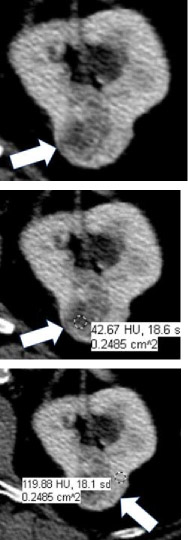
|
100% | 100% | CT attenuation can be determined in one or more regions of a renal mass. If the mass is homogeneous, the attenuation can be obtained with a single region of interest (ROI) that includes at least 2/3rds of the mass, being careful not to include tissues outside the mass. If the mass is heterogeneous, multiple smaller ROIs should be placed, taking care not to volume-average areas of different attenuation within the mass. Since attenuation may change depending on the phase of enhancement, reference to CT attenuation should be clear about when attenuation is being measured. | |
| Internal reference for attenuation | 100% | 100% | Renal mass attenuation (e.g., classified as hypo-, iso- or hyper-attenuating) is generally considered relative to renal cortex. However, reference standard anatomy should be specified in the report. When using the term 'attenuation' without referencing renal cortex or other reference standard, 'hypoattenuating' ‘isoattenuating’, and ‘hyperattenuating’ refer to a comparison to simple fluid (−9 to 20 HU). | ||
Fluid attenuation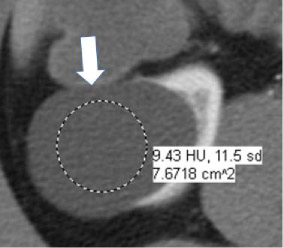
|
100% | 100% | Non-enhancing content within a mass measuring −9 HU to +20 HU. | ||
Macroscopic fat at CT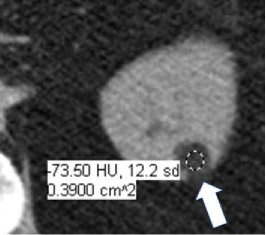
|
100% | 100% | Attenuation −10 HU or less (not reaching attenuation of air which is close to −1000). Pixel-based region of interest assessments will measure quantum mottle and are not reliable. Presence of fat cannot be confidently excluded on contrast-enhanced CT. | ||
Calcification at CT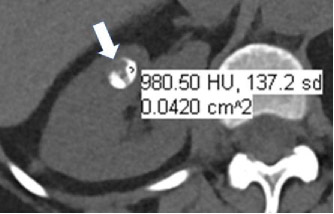
|
100% | 90% | Attenuation greater than 100 HU on unenhanced CT (excluding metal). Smaller calcifications may have lower attenuation because of volume averaging. Calcification cannot be confidently excluded on contrast-enhanced CT. | ||
| Morphologic categories of calcification - Thin 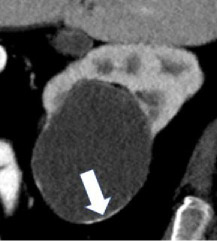 - Thick 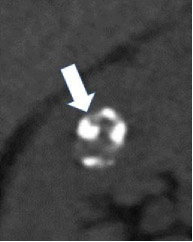 - Linear 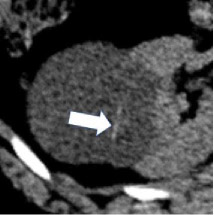 - Punctate 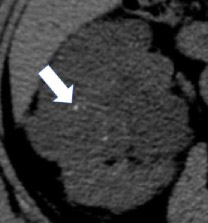 - Border-forming 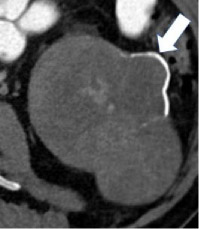 - Non-border-forming 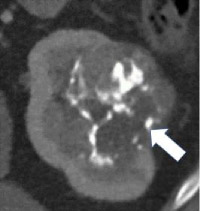
|
100% | 90% | Calcification may be further characterized as thin or thick, linear or punctate, border-forming or non-border-forming. | Clinical significance of morphologic appearance of calcification within a renal mass is controversial. | |
Hemorrhage at CT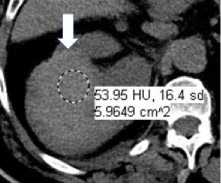
|
100% | 90% | Hyperattenuating nonenhancing area(s) within or around a renal mass. Since the CT attenuation of hemorrhage is variable and dependent on factors such as hemoglobin concentration and age of hemorrhage, there is no specific attenuation range that is diagnostic of hemorrhage; however, hemorrhage typically ranges from 40-100 HU. | One panelist suggested using attenuation range of 40-70 HU for hemorrhage at CT. | |
Enhancement at CT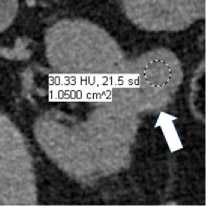 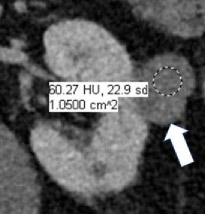
|
100% | 90% | Increase in attenuation ≥20HU using region(s) of interest on any contrast-enhanced phase relative to unenhanced imaging. Equivocal enhancement is an increase in attenuation ≥10 HU but < 20 HU, and no enhancement is an increase in attenuation <10 HU. The post-contrast phase should be acquired ≤2 minutes after contrast administration using the same parameters as the unenhanced imaging. When determining if a mass is enhancing at CT, the attenuation of the most enhancing portion of the mass is measured and compared to the same region on unenhanced imaging. | One panelist suggested removing the 2-minute time limit for assessment of enhancement. | |
| MRI terms | Signal intensity | 100% | 100% | MRI signal intensity (‘brightness’) can be determined in one or more regions of a renal mass. Since signal intensity may change depending on the sequence type and phase of enhancement, reference to signal intensity should be clear about what is being measured. The intensity is generally compared to normal renal cortex. If another reference standard is used it should be specified (such as "hyperintense compared to the muscle"). | |
| Fat at MRI - Microscopic 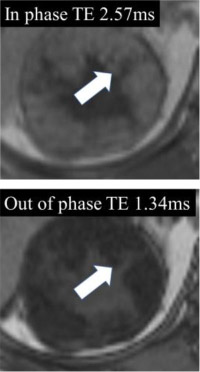 - Macroscopic 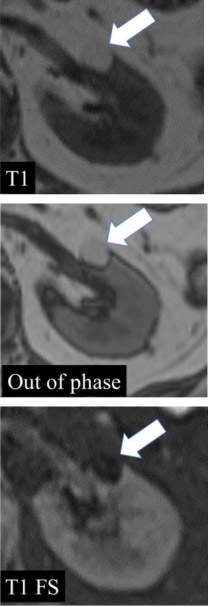
|
100% | 90% | When describing ‘fat’ at MRI, either ‘macroscopic fat’ or ‘microscopic fat’ should be used. Macroscopic fat is thought to be present when there is 1) loss of intratumoral signal intensity before and after application of fat-suppression (i.e with no changes in any of the other acquisition parameters), or 2) linear or curvilinear chemical shift artifact causing India-ink (etching) artifact within or at the periphery of the mass at macroscopic fat-water interfaces, while the central area (i.e. inside the etching artifact) remains hyperintense (i.e., following the signal intensity of subcutaneous and intraabdominal fat). Microscopic fat is thought to be present when there is non-linear non-curvilinear focal or diffuse signal intensity loss in any portion of a renal mass on the opposed-phase relative to in-phase T1-weighted images. |
One panelist suggested that 1-19% proton density fat fraction on multi-echo DIXON acquisitions in any portion of a renal mass may indicate microscopic fat. | |
Hemorrhage at MRI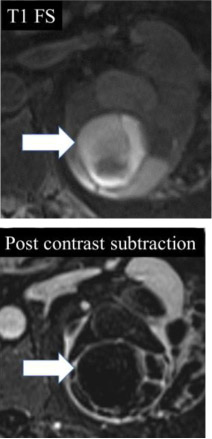
|
100% | 100% | Non-enhancing high signal intensity (relative to renal cortex) on pre-contrast fat-suppressed T1-weighted images. Proteinaceous content can appear similar. | ||
Enhancement at MRI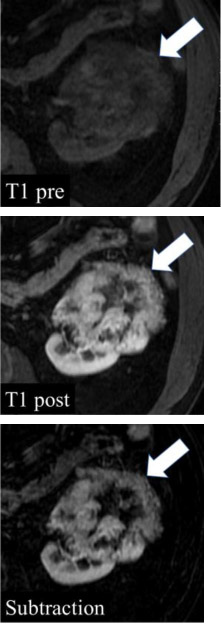
|
100% | 90% | Unequivocal visual enhancement or increase in signal intensity ≥15% using region(s) of interest on any contrast-enhanced phase relative to unenhanced imaging. No enhancement is an increase in signal intensity <15%. The post-contrast phase should be determined ≤2 minutes after contrast administration using the same parameters as the unenhanced imaging. Subtraction images (post-contrast minus pre-contrast) may be used to detect enhancement qualitatively by noting any signal in a portion of a mass; however, subtraction images need to be properly registered to avoid misregistration artifact. When determining if a mass is enhancing at MRI, the signal intensity of the most enhancing portion of the mass is measured and compared to the same region on unenhanced imaging. | One panelist suggested removing the 2-minute time limit for assessment of enhancement. | |
Restricted (impeded) diffusion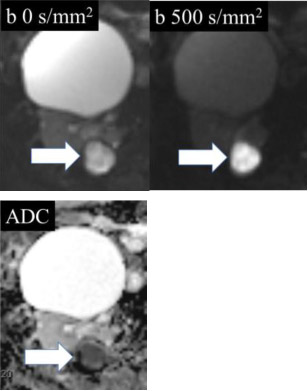
|
100% | 80% | Relative to the renal cortex, higher signal intensity in the mass on diffusion-weighted images with b-values >500 s/mm2 compared to a b-value of 0 s/mm2, or lower signal intensity on apparent diffusion coefficient map relative to renal cortex. | ||
Magnetic susceptibility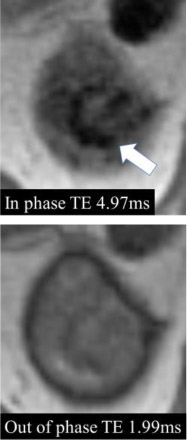
|
90% | 100% | Magnetic susceptibility is defined as a decrease in signal intensity on MRI images acquired with a longer echo time compared to images obtained with otherwise identical acquisition parameters except for shorter echo time. | One of the panelists pointed out that common causes of magnetic susceptibility artifact are hemosiderin, calcification, and gas. | |
| Miscellaneous terms | Heterogeneity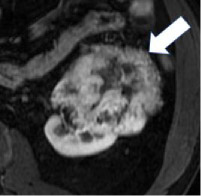
|
100% | 90% | Variable CT attenuation or MRI signal intensity. Assessment of heterogeneity may be done using visual inspection or by manually placing multiple regions of interest within a mass. There is no established quantitative definition. This definition does not include variable attenuation or signal as a result or artifacts or image noise. | Heterogeneity may be assessed quantitatively using texture analysis, but there are limited data on which features to use and methods of assessment. |
| Degree of enhancement - Hypovascular 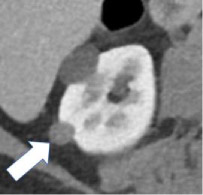 - Hypervascular 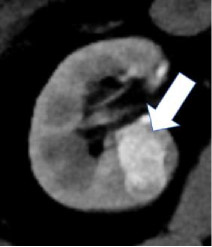
|
100% | 90% | Relative enhancement of a renal mass at a specific timepoint (e.g. corticomedullary phase), generally compared to the renal cortex. Degree of enhancement may be assessed qualitatively or quantitatively. Qualitatively, hypervascular masses typically enhance more than normal renal cortex and hypovascular masses enhance but less than normal renal cortex. Quantitatively, hyperenhancement refers to a mass with ≥70HU of absolute enhancement during the corticomedullary phase, and hypoenhancement refers to a mass with 20-40 HU of absolute enhancement during the corticomedullary phase. | No specific quantitative thresholds for degree of enhancement at MRI were established. | |
Growth rate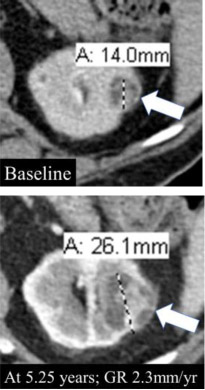
|
90% | 90% | Change in size divided by the length of time over which the size changed. *GR: Growth rate |
