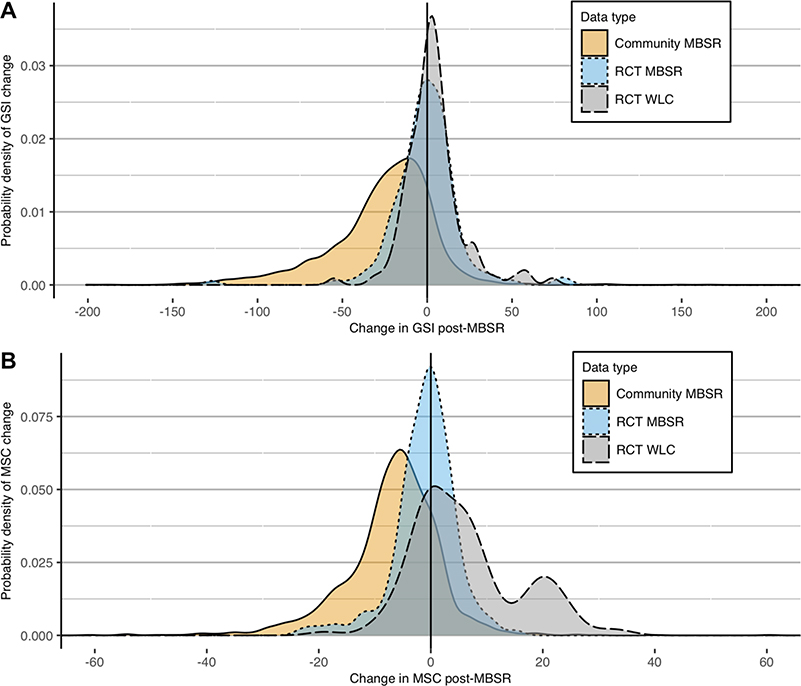
Figure 1. Smoothed Density Plot of Pre- to Post-Test Psychological (A) and Physical (B) Symptoms Change by Data type.
Note: A. GSI = Global Severity Index from the Symptoms Checkllist 90 Revised (Derogatis, 1992). B. MSC = Medical Symptoms Checklist total score. 0 point = no pre- to post-test change in symptoms.

