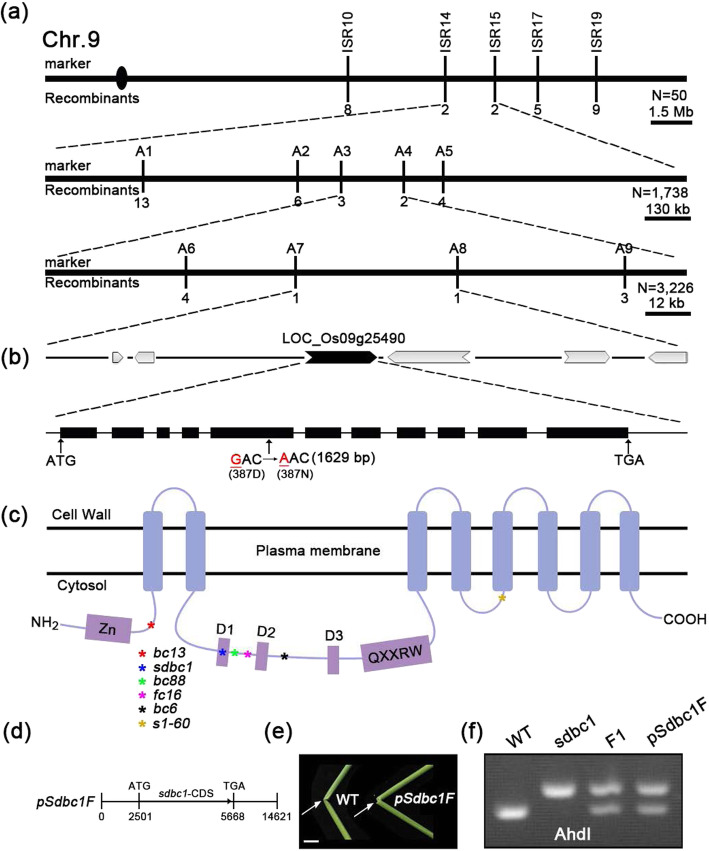
Fig. 3.
Map-based cloning of the SDBC1 gene. a The sdbc1 locus was mapped to the region between markers ISR14 and ISR15 on chromosome 9 and further narrowed to an approximately 45 kb region between markers A7 and A8. Vertical lines represent the positions of molecular markers and the number of recombinants. b 6 predicted ORFs within the fine mapping region and sequencing analysis revealed a point mutation that results one amino acid change at the 387th residue. c Protein structure of OsCESA9. Different color asterisks represent different OsCESA9 alleles. d A construct for complementary assay. e Folding the internodes of rice plants (indicated by the arrows) to show the reduced mechanical property in the complemented plants, Bar = 2 cm. f A CAPS marker (digested by AhdI) was developed to distinguish the WT and sdbc1 background

