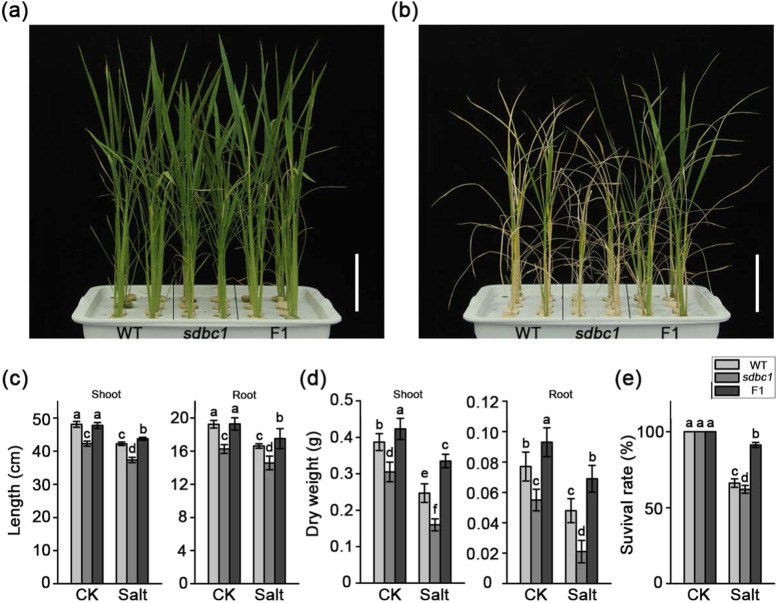
Fig. 8.
The Sdbc1 heterozygous (F1) plants have more tolerance to salt. a and b are the phenotypes of WT, sdbc1 and F1 plants before and after slat stress, respectively. c The shoot (left) and root (right) lengths for WT, sdbc1 and F1 plants under control and salt stress conditions. d The shoot (left) and root (right) biomasses per plant for WT, sdbc1 and F1 plants under control and salt stress conditions. e The survival rates of the WT, sdbc1 and F1 plants after salt stress treatment. Error bars indicate the SE of three biological repeats. Different letters denote significant differences (P < 0.05, Duncan’s multiple range test)

