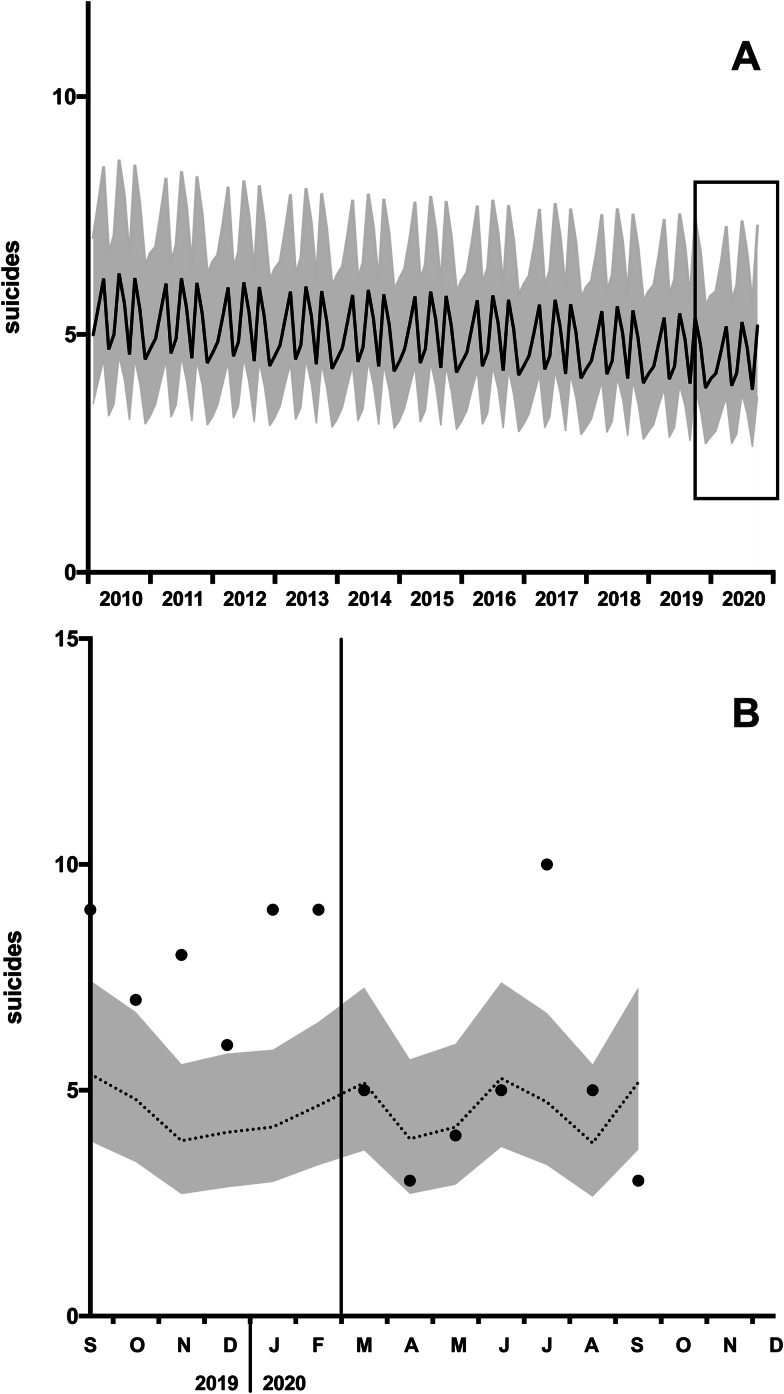
Fig. 2.
Suicide time trends. (A) Expected suicides (black line) and the 95% confidence interval (95% CI, grey corridor) based on the time series analysis of suicides in 2010 to 2019. The rectangle indicates the section shown below. (B) Projection of expected suicides (doted line), 95%CI and observed suicides (dots) of the individual months.

