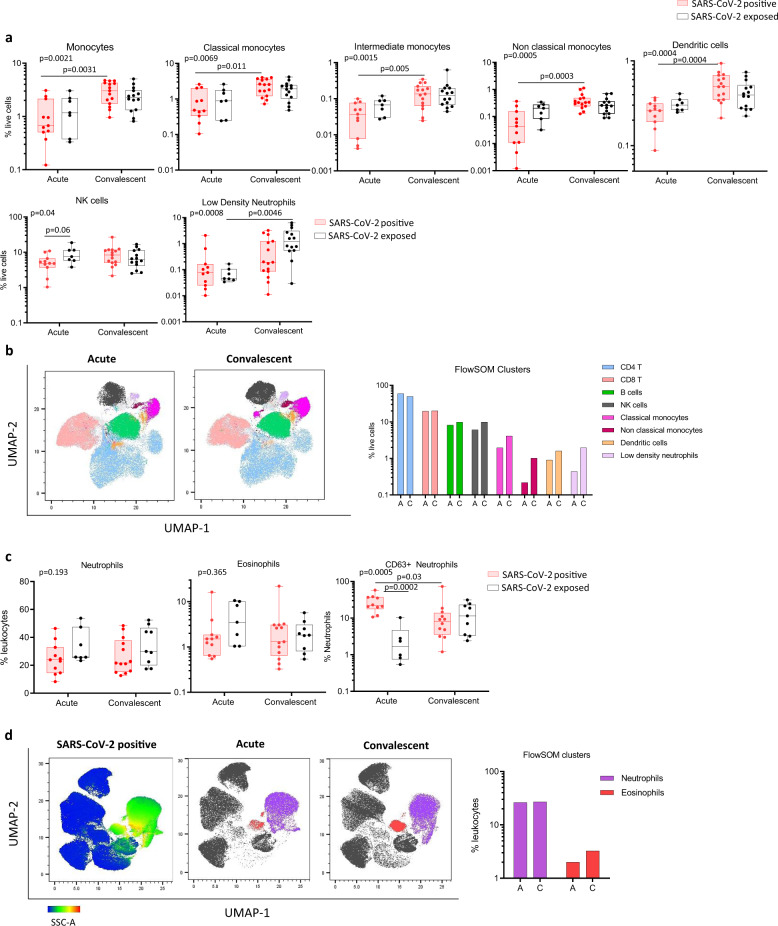
Fig. 1. Innate cell profiles of children infected with or exposed to SARS-CoV-2 during the acute and convalescent phase.
a Frequency of monocytes and subsets (classical, non-classical, intermediate), dendritic cells, NK cells and low-density immature neutrophils in PBMC samples of children during infection (SARS-CoV-2 positive n = 11, SARS-CoV-2 exposed n = 7) and in convalescence (SARS-CoV-2 positive n = 16, SARS-CoV-2 exposed n = 14). b Hierarchical clustering was performed on PBMC samples using FlowSOM and projected onto a UMAP plot. Frequencies of clusters corresponding to CD4 T, CD8 T, B cells, NK cells, classical monocytes, non-classical monocytes, dendritic cells and low-density neutrophils during acute (A) and convalescent (C) phase are reported. c Frequency of neutrophils and eosinophils in fresh whole blood (SARS-CoV-2 positive n = 11, SARS-CoV-2 exposed n = 7) and in convalescence (SARS-CoV-2 positive n = 13, SARS-CoV-2 exposed n = 9). Neutrophils were assessed for expression of activation marker CD63 (SARS-CoV-2 positive n = 11, SARS-CoV-2 exposed n = 6) and in convalescence (SARS-CoV-2 positive n = 13, SARS-CoV-2 exposed n = 9). d Hierarchical clustering was done on whole blood samples using FlowSOM and projected onto a UMAP plot, coloured by intensity of SSC-A expression in the first plot, and then by annotated granulocyte cell population. Frequencies of clusters corresponding to neutrophils and eosinophils are reported. P values by Kruskal-Wallis rank sum test and Dunn’s multiple comparison testing. All statistical tests were performed two-sided. Boxplots show the medians, the 1st and 3rd quartile as well as the smallest and largest values as whiskers.

