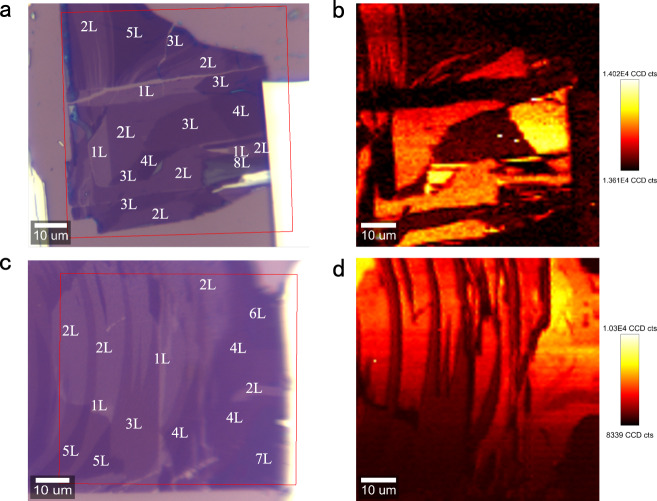
Fig. 3. SHG spatial mapping of few-layer PdSe2.
a, c The optical images of the PdSe2 flakes for the SHG characterization. The red boxes indicate the selected area for the SHG measurements. The layer numbers are labeled by the white numbers. The region elected in a contain 1–5 L and 8 L PdSe2, and the area selected in c includes 1–7 L PdSe2, ensuring sufficient sampling. The PdSe2 samples were excited by 800 nm wavelength using 50× objective with a NA value of 0.55. b, d The spatial mapping of the integrated SHG signals corresponding to the regions in a and c, respectively. The intensities of the SHG signals are different for different layers. The SHG signal is almost absent in the odd-layer PdSe2, while it is strong in the even-layer PdSe2. The color bars are shown on the right of the figure.

