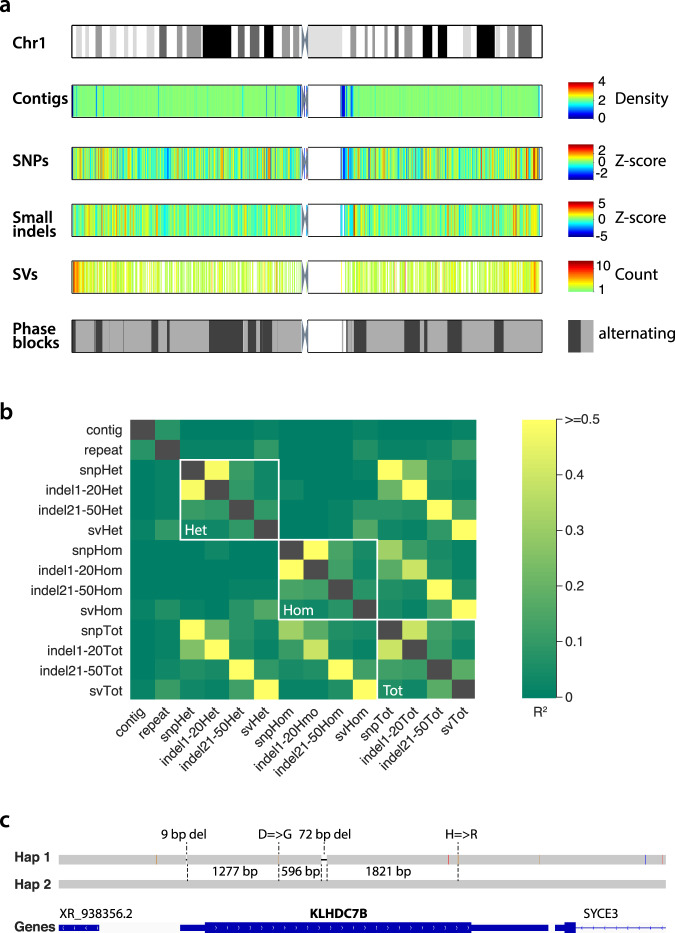
Fig. 3. Local distribution of all types of variation detected, aggregated across 250 kb intervals.
a Top, ideogram of Chromosome 1 showing metaphase banding pattern. Tracks below are assembly and variation features where white represents no data. Contigs, average contig coverage. SNPs, Z-score of SNP number. Small indels, Z-score of the number of indels 1–50 bp. SVs, number of SVs ≥ 50 bp in each 250 kb bin. Phase blocks, each phase block is a gray rectangle, with alternating light and dark indicating neighboring phase blocks. b Genome-wide correlation (R2) among all pairs of variation types by genotype, contig density, and repeat density. c Example of phased exonic variants in cis within the KLHDC7B gene, where Haplotype 1 carries the alternate alleles and Haplotype 2 carries the reference alleles.

