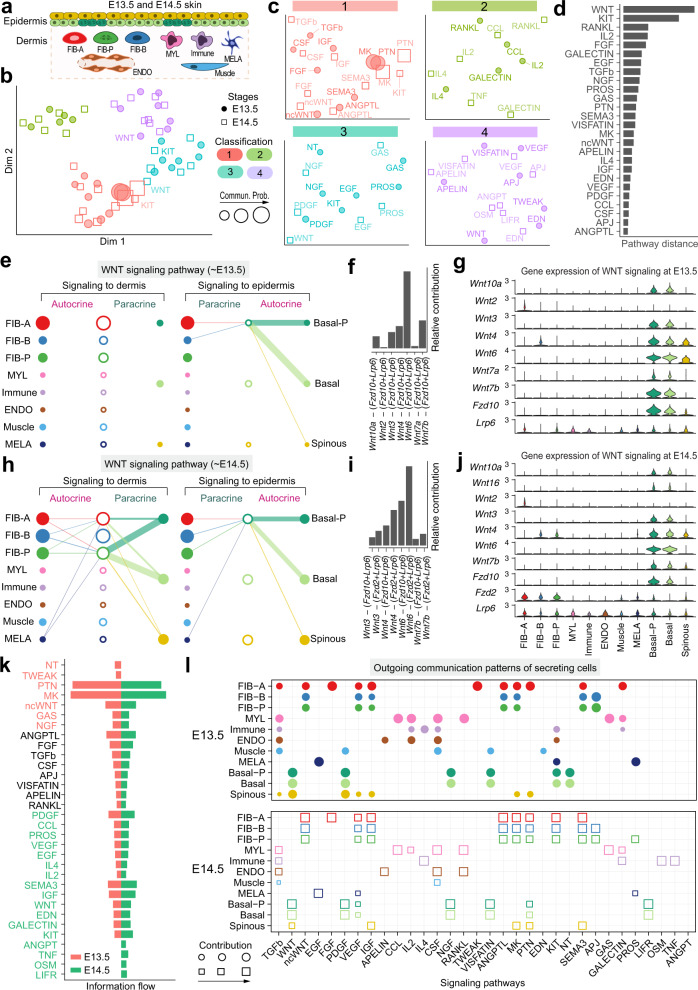
Fig. 5. Comparison analysis of epidermal-dermal communications between different skin developmental stages.
a Schematic illustration of cellular composition of embryonic skin at E13.5 and E14.5. Different cell populations are color-coded to match colors in panel e and h. FIB-A: fibroblast type A; FIB-B: fibroblast type B; FIB-P: proliferative fibroblasts. MYL: myeloid cell; ENDO: endothelial cell; MELA: melanocytes; b Jointly projecting and clustering signaling pathways from E13.5 and E14.5 into a shared two-dimensional manifold according to their functional similarity. Circle and square symbols represent the signaling networks from E13.5 and E14.5 respectively. Each dot or square represents the communication network of one signaling pathway. Dot or square size is proportional to the total communication probability. Different colors represent different groups of signaling pathways. c Magnified view of each pathway group. d The overlapping signaling pathways between E13.5 and E14.5 were ranked based on their pairwise Euclidean distance in the shared two-dimensional manifold. e The inferred WNT signaling network at E13.5. Left and right portions show the autocrine and paracrine signaling to dermis and epidermis, respectively. Circle sizes are proportional to the number of cells in each cell group and edge width represents the communication probability. f Relative contribution of each ligand-receptor pair to the overall WNT signaling network at E13.5. g Expression distribution of WNT signaling genes at E13.5. h The inferred WNT signaling network at E14.5. i Relative contribution of each ligand-receptor pair at E14.5. j The expression distribution of WNT signaling genes at E14.5. k All significant signaling pathways were ranked based on their differences of overall information flow within the inferred networks between E13.5 and E14.5. The top signaling pathways colored red are more enriched in E13.5, the middle ones colored black are equally enriched in E13.5 and E14.5, and the bottom ones colored green are more enriched in E14.5. l The dot plot showing the comparison of outgoing signaling patterns of secreting cells between E13.5 and E14.5. The dot size is proportional to the contribution score computed from pattern recognition analysis. Higher contribution score implies the signaling pathway is more enriched in the corresponding cell group.

