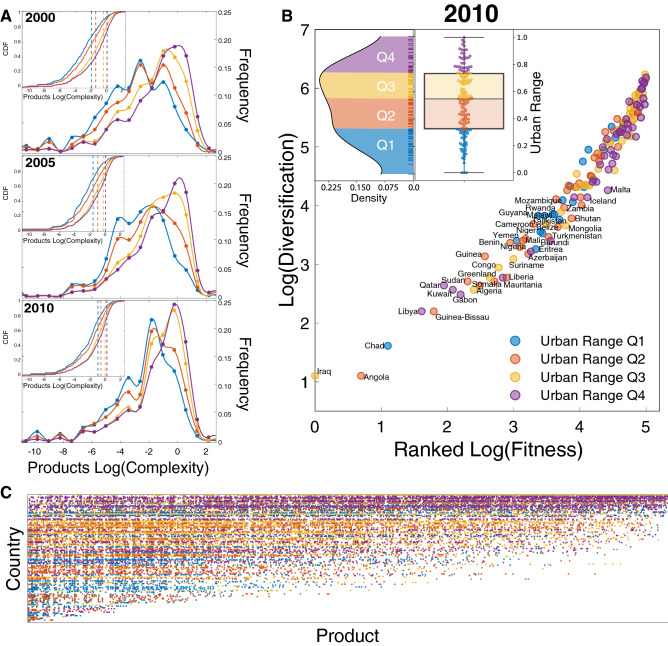
Figure 1.
(A) Distribution of exported products complexity by different urbanization levels through the 2000–2010. There is a shift of lower urbanized countries towards the export of more complex products (B) Distribution of the Urban Range (percentage of the total population living in urban areas) of the 144 countries analyzed. (B) Ranked country fitness versus products export diversification, the highly diversified countries are one’s with more fitness and high urbanization, meanwhile low urbanized country are in the center bottom of the scatter plot, with some exceptions such as those with links to the oil countries. (C) Matrix of the country exports in 2010, reordering the countries and products by fitness and complexity; the color dots represent an exported product under the RCA threshold Eq. (2), the color gradient follows the urban range definition.

