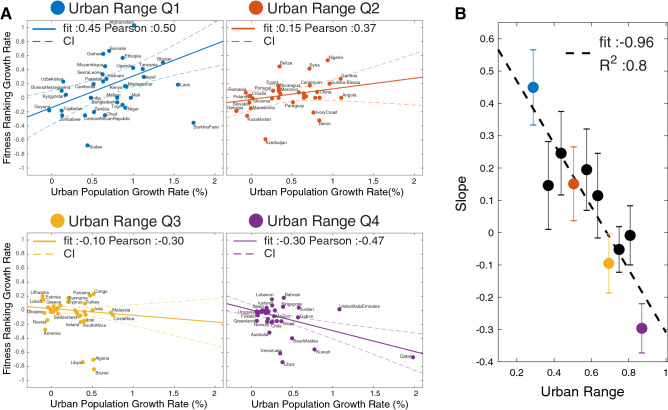
Figure 3.
(A) The Fitness Ranking Growth Rate versus Urbanization Growth Rate. The effect of urbanization growth on the transformation of the economic systems (or vice-versa) is more relevant in low urbanize countries. The dashed lines represent the 95% Confidence Interval (CI) of the linear regression. (B) Slope coefficient of a sliding window across of the countries (corresponding to 36 countries) of its fitness ranking growth rate versus urban population growth rate. The error bar corresponds to the fit’s confidence interval. The colors follow the Urban Range Scheme.

