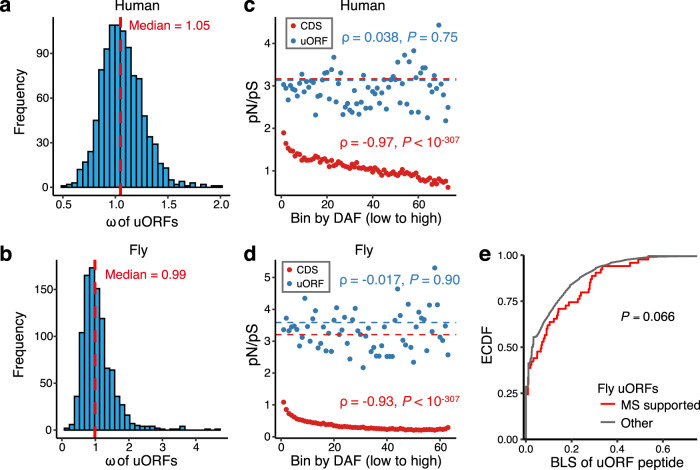
Fig. 5. Selective constraints on coding regions of upstream open reading frames (uORFs).
a Distribution of the number of nonsynonymous changes per nonsynonymous site over the number of synonymous changes per synonymous site (ω) of uORFs between humans and rhesus macaques. Human uORFs were equally divided into 1000 bins based on the start codon of uORFs with an increasing Kozak score. For each bin, the alignments of uORF sequences between human and rhesus macaque were concatenated to calculate the ω value. b Distribution of the ω values of uORFs between D. melanogaster and D. simulans. The procedure for ω calculation was similar to that described in a. c The ratio of the nonsynonymous to synonymous SNP numbers (pN/pS) in coding sequences (CDSs, red) and uORFs (blue) in bins with an increasing derived allele frequency (DAF). Spearman’s correlation (ρ) between the pN/pS ratio and the median DAF of each bin of uORFs and CDSs is displayed in the plot with two-sided P values. d Same as c but for fly uORFs. e The empirical cumulative distribution function of (ECDF) of peptide branch length score (BLS) for mass spectrometry (MS)-supported uORFs and the remaining uORFs in flies. uORFs with <10 amino acids were excluded. The one-sided t-test was performed to test differences in BLS. Source data are provided as a Source Data file.

