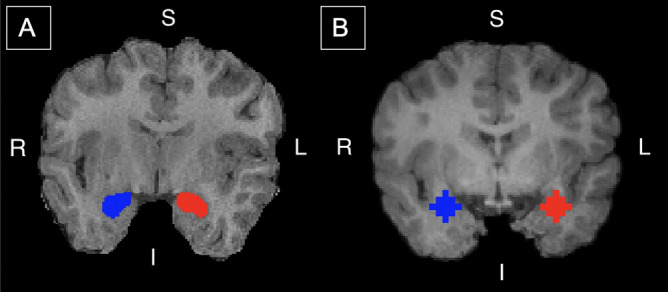
Figure 4.

Amygdala segmentation and regions of interest. (A) Segmentations of the right (blue) and left (red) amygdala. Segmentations of each participant’s brain were obtained from raw T1 images with Multi-atlas Cortical Reconstruction Using Implicit Surface Evolution (MaCRUISE) software and were used to analyze the relationship between maternal anxiety and child amygdala volume. (B) Amygdala seed regions used in the functional connectivity analysis. Regions are overlayed on a T1 image registered to a pediatric brain template in standard space. Seed regions were defined with a 6 mm radius sphere centered at − 25, 1, − 18 (red; left amygdala) and 26, 1, − 18 (blue; right amygdala). Coordinates were obtained from the Automated Anatomical Labeling atlas (AAL). S—superior; I—inferior; R—right; L—left. The segmentations and regions of interest are displayed on the same participant.
