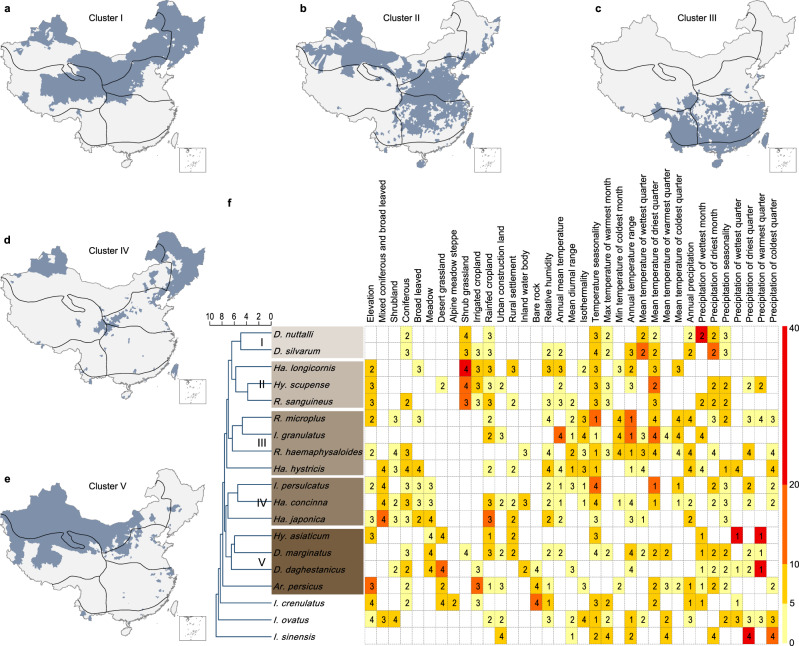
Fig. 2. Clustering of tick species based on their ecological features and spatial distributions at the county level.
Panels a‒e indicate the spatial distribution of the five clusters (clusters I‒V). The boundaries of the seven biogeographic zones are shown as black solid lines. The dendrogram in panel f displays the clusters I‒V of tick species. The features used for clustering are three quantities associated with each predictor in the BRT models. Two of the three quantities were displayed in panel f to indicate the possible level of ecological suitability: relative contributions (colors in ascending order from yellow to red) and the standardized median value of the predictor (numbers in the heatmap) among counties with tick occurrence (numbers 1‒4 indicate the position of this median in reference to the quartiles of this predictor among all counties). Source data are provided as a Source Data file.

