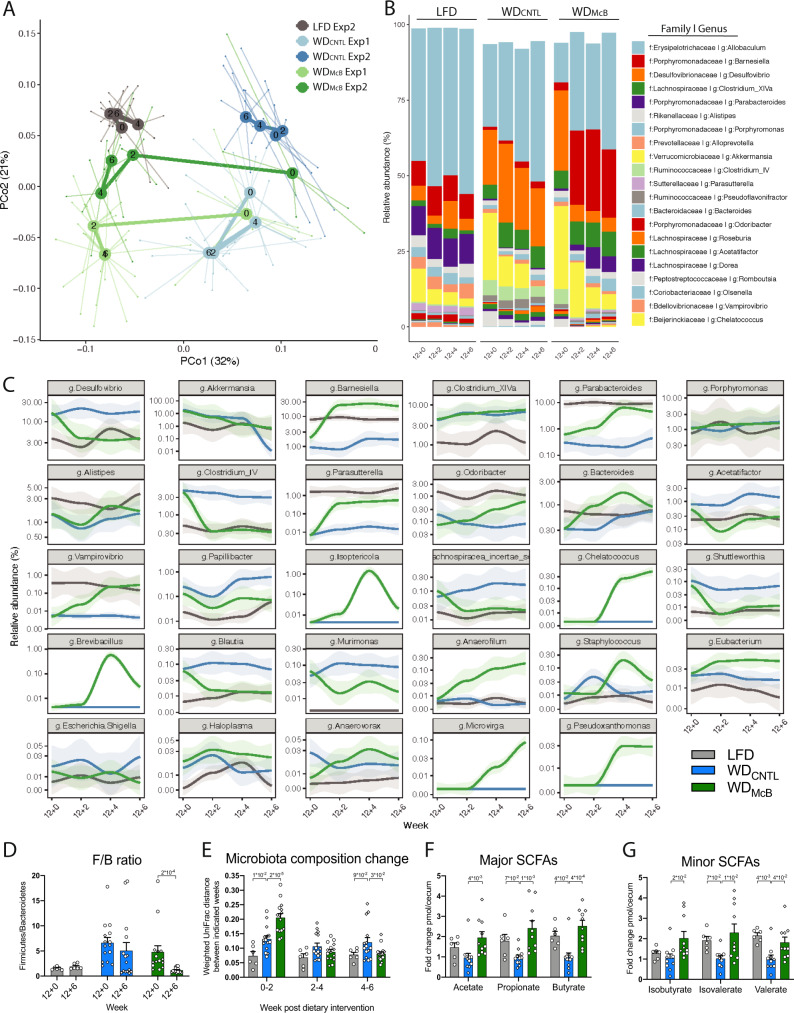
Fig. 1. McB feeding reverses WD-induced gut microbiota changes and increases cecal SCFA levels.
A Principle coordinate analysis (PCoA) using Weighted UniFrac distances of fecal microbiota sampled from first and second experiment biweekly during the dietary intervention period, as indicated by numbers post dietary intervention in centroids. The WDCNTL and WDMcB groups were similar in microbiota composition prior to dietary intervention week 12 + 0 (PERMANOVA p = 0.88 and 0.43 in Exp1 and Exp2, respectively). At the end of each experiment, the microbiota composition was significantly different between these groups (PERMANOVA p = 0.001 and 0.002 in Exp1 and Exp2, respectively). B Taxasummary of most abundant bacterial genera showing mean relative abundance in % of indicated family and genera in each group at indicated time points. C Deseq analysis of fecal bacterial genera abundances significantly regulated by McB intervention compared to the WDCNTL (p.adj. < 0.05). Relative abundance in % in each group and variation are shown for each regulated genus at the sampled time points. Fold-change and adjusted p values of individual genera are indicated in Supplementary Table 3. D Relative Firmicutes/Bacteroidetes ratio of fecal samples of individual mice before (12 + 0) and after 6 weeks of dietary intervention (12 + 6). Statistical significance is indicated by p value on Wilcoxon matched-pairs signed rank test. E Weighted UniFrac distance (instability test) between paired samples from indicated 2-weeks’ interval post dietary intervention. Statistical significance is indicated by p value on RM two-way ANOVA with multiple comparison and Bonferroni’s post-hoc. D, E LFD n = 6, WDCNTL and WDMcB n = 15 per group. F Major short-chained fatty acids (SCFAs) in cecal content as fold-change pmol per cecum. Propionate data was tested by one-way ANOVA and Dunnett’s multiple comparisons test. Acetate and butyrate data was tested by Kruskal–Wallis test and Dunn’s multiple comparisons test. LFD n = 6, WDCNTL n = 11, and WDMcB n = 10. G Minor SCFAs in cecal content as fold-change pmol per cecum. Isobutyrate and isovalerate data were tested by Kruskal–Wallis test and Dunn’s multiple comparisons test. Valerate data were tested by one-way ANOVA and Dunnett’s multiple comparisons test. LFD n = 6. WDCNTL and WDMcB n = 10 per group. D–G Bars indicate group mean ± SEM and individuals data points in Exp1 (squares) and Exp2 (circles) with p-values < 1 × 10⁻¹ between WDCNTL and indicated group using the specified statistical test.

