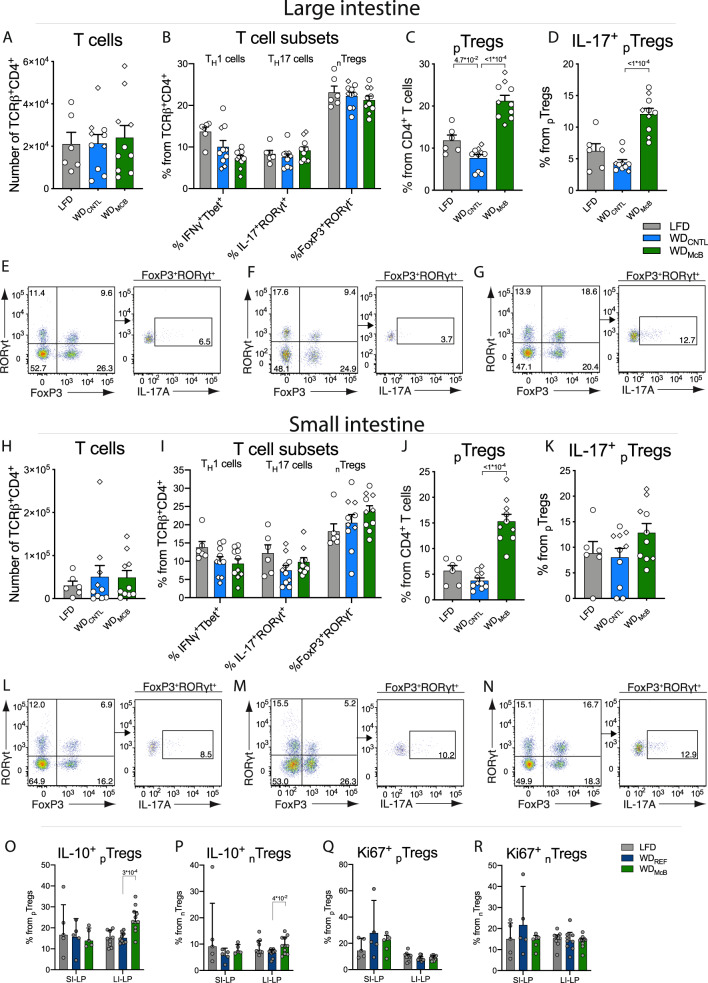
Fig. 2. WDMcB feeding stimulates induction of gut-specific regulatory T cells.
A–D Number of indicated cells in colon. E–G Representative plots of colonic TCRβ+CD4+ FoxP3+ RORγt+ pTregs (left) and IL-17+ pTregs (right) in LFD (E), WDCNTL (F), and WDMcB (G) group. H–K Number of indicated cells in small intestine. L–N TCRβ+CD4+ FoxP3+ RORγt+ pTregs (left) and IL-17+ pTregs (right) in LFD (L), WDCNTL (M), and WDMcB (N) group. O–R Percentage of indicated cells in SI- and LI-LP from ‘weight-matched’ mice housed at thermoneutrality. A–N Dots indicate individuals data points in Exp1 (squares) and Exp2 (circles) with n = 6 (LFD) or 10 (WDMcB and WDCNTL). O–R SI-LP n = 5 per group and LI-LP n = 9 (LFD and WDREF groups) or 11 (WDMcB). A–D, H–K, O–R Bars indicate group mean ± SEM and dots indicate individual data points. All p-values < 1 × 10⁻¹ between WDCNTL and indicated group by one-way ANOVA with multiple comparisons and Dunnett post-hoc are depicted.

