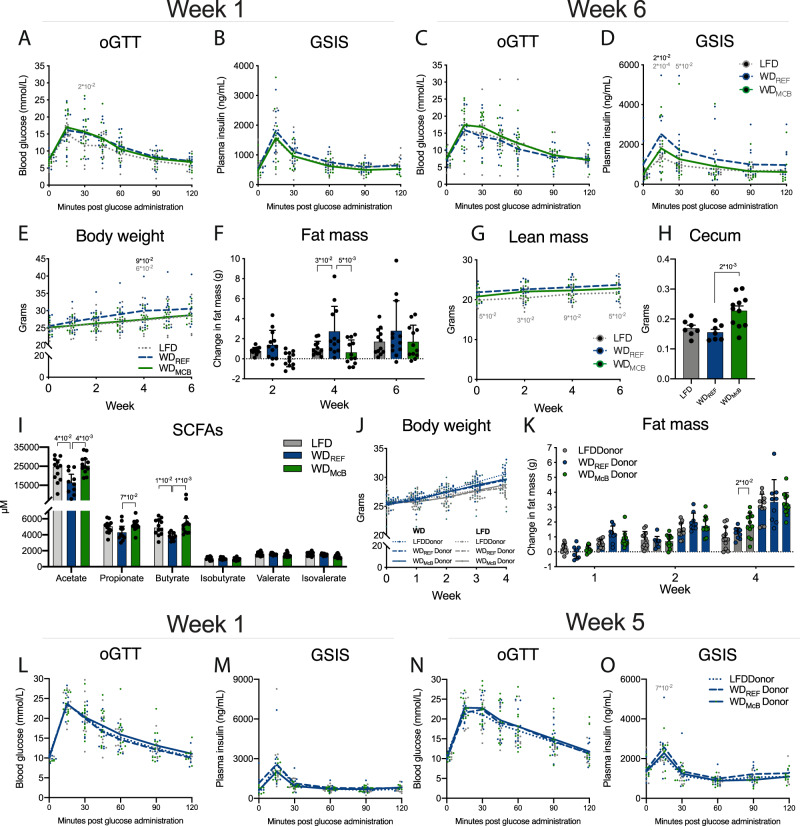
Fig. 8. Altered gut microbiota by WD feeding affects glucose regulation.
A, C OGTT in 5 h fasted RAG2-/- mice after 1 and 6 weeks of dietary intervention as indicated. Statistical significance compared to WDREF by two-way ANOVA-RM, adjusted for multiple comparisons by Dunnett post-hoc. n = 12 mice per group. B, D Glucose stimulated Insulin Secretion during OGTT after 1 and 6 weeks of dietary intervention. Statistical significance compared to WDREF by mixed effects analysis RM, adjusted for multiple comparisons by Dunnett post-hoc. n = 12 mice per group except for WDMcB group at 120 min in B, WDMcB group at 60 min in D, and WDREF group at 15 min in D where n = 11 due to insufficient sample material. E–G Body weight, fat mass and lean mass, as indicated, at indicated time points post dietary intervention. Statistical significance of body weight compared to WDREF by mixed effects analysis RM, adjusted for multiple comparisons by Dunnett post-hoc, and fat and lean mass by two-way ANOVA-RM, adjusted for multiple comparisons by Dunnett post-hoc. n = 12 mice per group except for WDMcB group Week 1 in E where n = 9. H Cecum weight at termination. Statistical significance compared to WDREF group by one-way ANOVA, adjusted for multiple comparisons by Dunnett post-hoc test. n = 7 (LFD and WDREF) or 11 (WDMcB). I Concentration of short chain fatty acids in cecum from H. Statistical significance compared to WDREF group by Kruskal–Wallis test, adjusted for multiple comparisons by Dunn’s post-hoc. n = 12 (LFD and WDMcB) or 10 (WDREF). J, K Body weight and fat mass development in ABX treated WT mice fed either LFD (grey bars) or WDREF (blue bars), receiving cecal microbiota from indicated donor mice. Statistical significance compared to WDREF by two-way ANOVA-RM, adjusted for multiple comparisons by Dunnett post-hoc. WD-fed mice n = 11 (LFD donor), 9 (WDREF donor), and 12 (WDMcB donor). LFD-fed mice n = 12 (LFD donor), 9 (WDREF donor), and 12 (WDMcB donor). L, N OGTT in 5 h fasted WDREF-fed WT recipient mice 1 and 5 weeks after first cecal microbiota transfer, as indicated. Statistical significance compared to WDREF by two-way ANOVA-RM, adjusted for multiple comparisons by Dunnett post-hoc. LFD donor n = 11, WDREF donor n = 9, and WDMcB donor n = 12. M, O Glucose stimulated Insulin Secretion during OGTT (L + N) 1 and 5 weeks after first cecal microbiota transfer. Statistical significance compared to WDREF by two-way ANOVA-RM, adjusted for multiple comparisons by Dunnett post-hoc. In M, LFD donor n = 11 except at 0 min where n = 4, WDREF donor n = 9 except at 0 min where n = 6, and WDMcB donor n = 12 except at 0 min where n = 9. In O, LFD donor n = 10, WDREF donor n = 8 except at 90 min where n = 9, and WDMcB donor n = 11 except at 90 min where n = 12. Reduced n-size reflects insufficient sample material at indicated timepoint. A–E, G, J, L–O Lines represent group mean and dots indicate individual data points. F, H, I, K Bars represents mean ± SEM. Dots indicate individual data points. A–O All p-values < 1 × 10⁻¹ between WDREF and indicated group are depicted.

