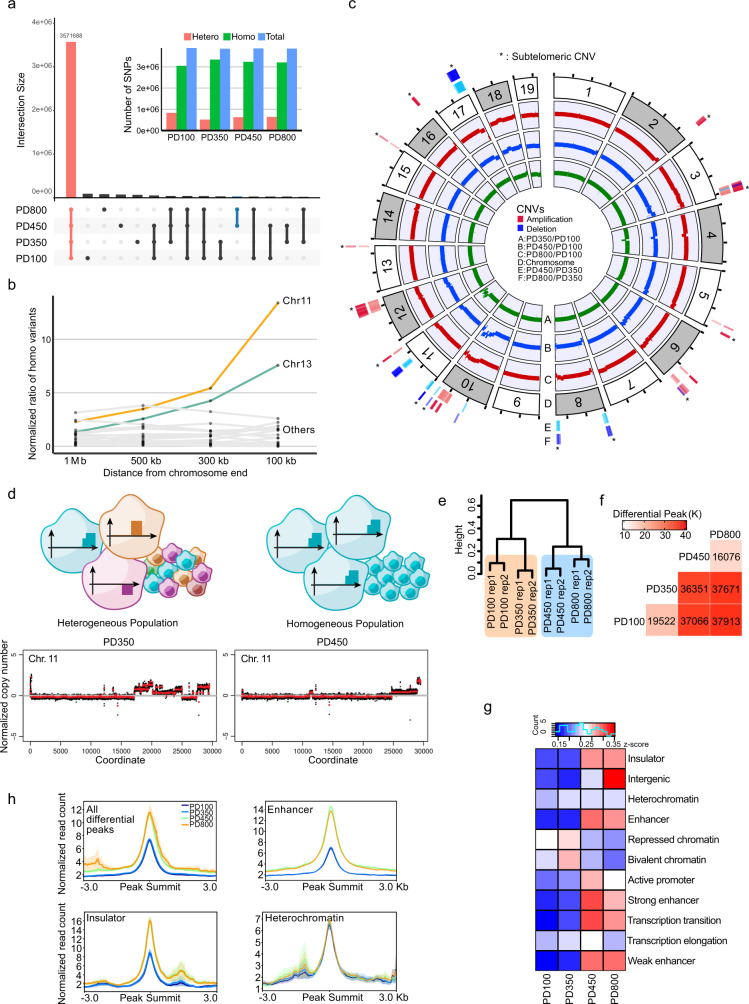
Fig. 3. ALT mESCs experienced extensive copy-number variations (CNV) and epigenetic remodelling.
a Genome-wide SNP analysis at each time point. The connected lines denote groups sharing SNPs. (Inside) Number of SNPs sorted by allelic zygosity. b Numbers of homozygous SNPs of each chromosome focusing on subtelomeric regions. c Copy-number variation (CNV) analysis. Green, blue, and red each denote the CNV of PD350, PD450, and PD800, respectively, compared to PD100 as the control. The outermost colour represents the CNV of PD800 compared to PD350, and the inner colour represents the CNV of PD450. d (Top) CNVs of chromosome 11 at PD350 and PD450. (Bottom) Schematics of the cellular heterogeneity at PD350 and the selected result at PD450. e Hierarchical clustering of ATAC-seq peaks. f Heat map of differential ATAC-seq peaks. g Heat map of the functional terms of ATAC-seq data. Colour index indicates the relative proportion of each time point. h Normalised differential ATAC-seq peaks aligned to the peak summit. The solid lines and the error bands represent the mean of each data and the standard errors of the mean, respectively. Source data are provided as a Source Data file.

