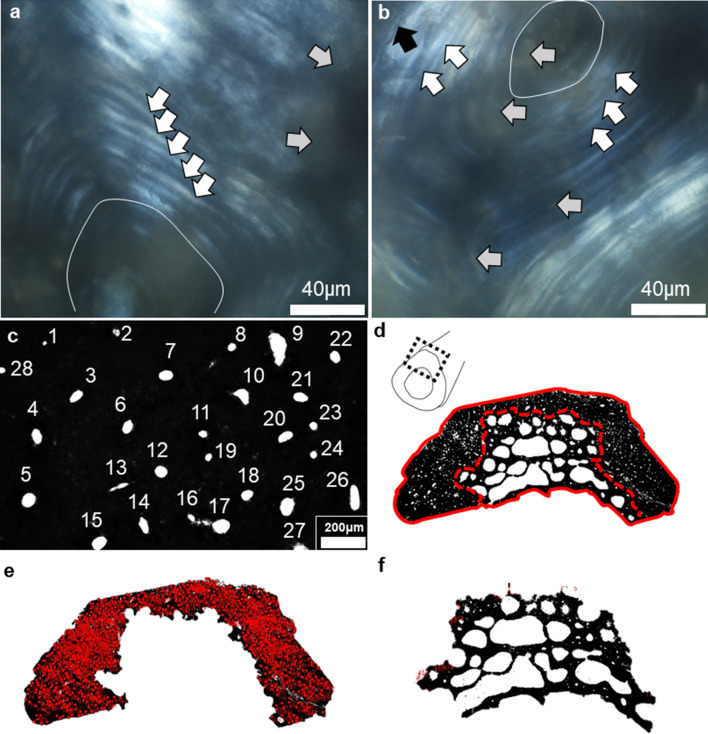
Figure 2.
A summary of histomorphometric procedures for estimating densities of Haversian canals and abnormal intra-cortical bone porosity. (a, b): localised histology (60 ×) viewed under linearly polarised light showing secondary osteon lamellae (white arrows) surrounding Haversian canals (oval features), which were obscured by patches of diagenesis (grey arrows). Cement lines (black arrow in b) were inconsistently preserved (examples shown are from individuals BG2 (a) and Sk9.3 (b). Haversian canals were counted manually form thresholded images (c–f): (c) shows numbered canals, (d) shows manual segmentation of cortical wall from abnormal intra-cortical porosity (red dashed line), while the solid line marks whole section area in individual BG2; (e) illustrates final counts of Haversian canals, while (f) shows ‘extracted’ abnormal bone porosity.

