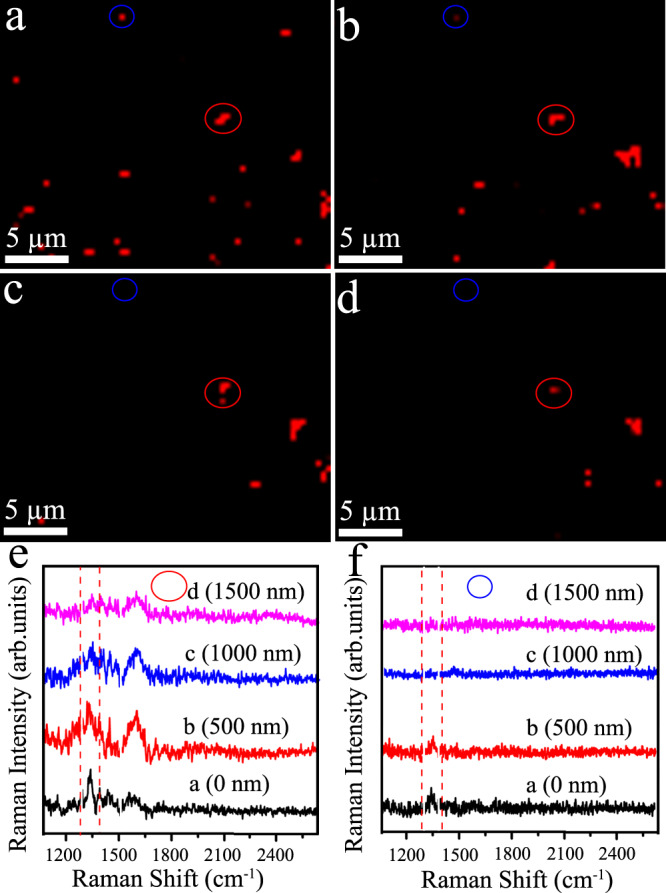
Fig. 3. Study of confocal height on Raman signal intensity.

SERS mapping of FGF-2 SERS nanotags on the silicon substrate with changing confocal height of a 0 nm, b 500 nm, c 1000 nm, and d 1500 nm; selected Raman spectra obtained from e red circles and f blue circles of SERS images. Red dotted lines in e and f indicate peak signal at 1330 cm−1 from DTNB. Data from one independent experiment. Source data are provided in the Source Data file.
