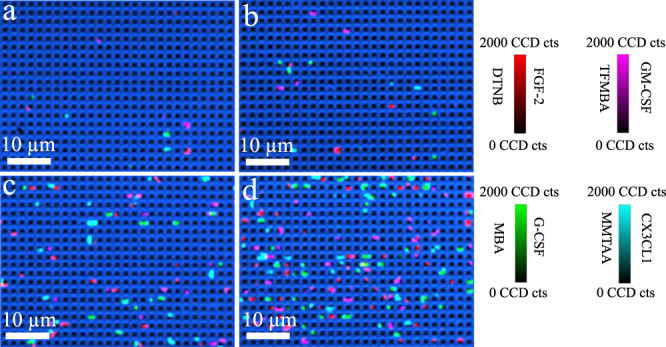
Fig. 6. Sensitivity for the simultaneous detection of four cytokines.

Representative confocal SERS images of fibroblast growth factor 2 (FGF-2), granulocyte colony-stimulating factor (GM-CSF), granulocyte colony-stimulating factor (G-CSF), and fractalkine (CX3CL1) with the concentration of a 2.6 aM, b 26 aM, c 260 aM, d 1031 aM. Colour scale bars indicate Raman intensities from 5,5-dithiobis (2-nitrobenzoic acid) (DTNB), 4-mercaptobenzoic acid (MBA), 2,3,5,6-tetrafluoro-4-mercaptobenzoic acid (TFMBA), or 2‐mercapto‐4‐methyl‐5‐thiazoleacetic acid (MMTAA). The median (interquartile range) of active pillars per scanning image of FGF-2, G-CSF, GM-CSF, CX3CL1 for 2.6 aM: 3 (1.5–3), 1 (1–2), 2 (1–3), 2 (1–3); 26 aM: 8 (5.5–10), 10 (9–13), 7 (6–10), 8 (6–10); 260 aM: 40 (36–48), 40 (35–52), 39 (35–50), 37 (36–49); and 1031 aM: 79 (61.5–97), 78 (72–87.5), 88 (68.5–97), 79 (64–95), respectively. Data represents one experiment from three independent tests.
