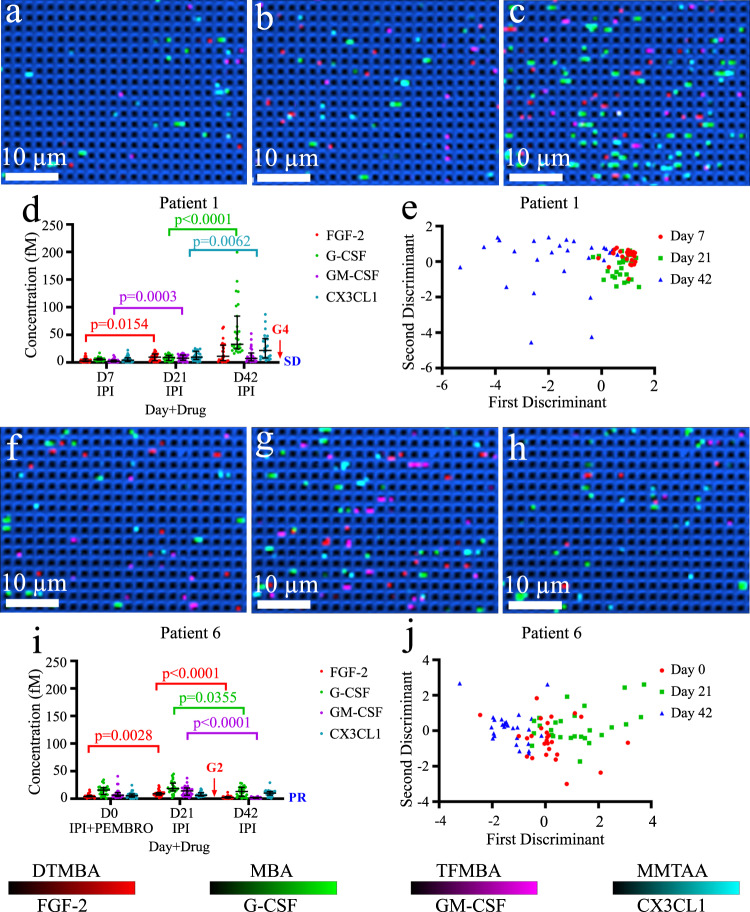
Fig. 7. Digital nanopillar SERS assay for monitoring melanoma patients during immune checkpoint therapy.
For Patient 1 who developed severe irAEs, SERS images for cytokine detection on a day 7, b day 21, c day 42, d cytokine concentration graph for fibroblast growth factor 2 (FGF-2), granulocyte colony-stimulating factor (G-CSF), granulocyte-macrophage colony-stimulating factor (GM-CSF), and fractalkine (CX3CL1). The two shorter horizontal lines denote the interquartile ranges (25th and 75th percentile) and the longer horizontal lines in between denote the median (50th percentile), and e LDA analysis, respectively. For Patient 6 who developed mild irAEs, SERS images for cytokine detection on f day 0, g day 21, h day 42, i four cytokine concentration graph, the two shorter horizontal lines denote the interquartile ranges (25th and 75th percentile) and the longer horizontal lines in between denote the median (50th percentile), and j LDA analysis, respectively. IPI ipilimumab, PEMBRO pembrolizumab; G3 grade 3, G2 grade 2; SD stable disease, PR partial response. For Patient 1, the median (interquartile range) of active pillars per scanning image of FGF-2, G-CSF, GM-CSF, CX3CL1 on day 7: 14 (11–22.5), 23 (21, 29), 12 (7.5–18), 17 (9–25.5); day 21: 30 (19–37.5), 33 (19–41), 26 (17.5–36.5), 29 (21–43); and day 42: 33 (16.5–58.5), 76 (64–128.5), 25 (14–39.5), 48 (26.5–73.5), respectively. For Patient 6, the median (interquartile range) of active pillars per scanning image of FGF-2, G-CSF, GM-CSF, CX3CL1 on day 0: 18 (16–23), 49 (31.5–56), 23 (17.5–28), 20 (14.5–27); day 21: 29 (24–33.5), 53 (46.5–70), 35 (25–46), 22 (19–29.5); and day 42: 13 (8–16.5), 44 (23.5–55.5), 10 (6.5–12.5), 30 (24–34.5), respectively. The data represented three technical replicates obtained from three chips. Nine images were acquired from each chip for cytokine counting. Statistical analysis was based on Kruskal–Wallis test followed by Dunn’s test to correct multiple comparisons (two-sided). Source data are provided in the Source Data file.

