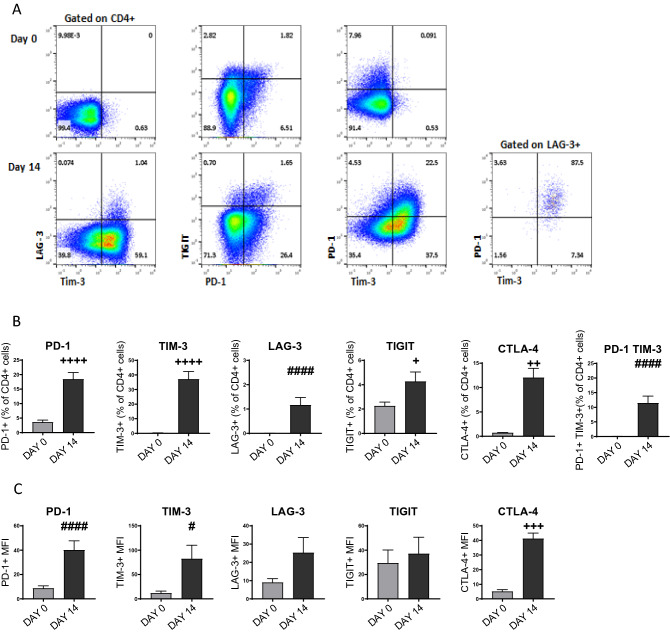
Figure 3.
Exhausted CD4+ T cell phenotype. Representative (n = 6) flow cytometry plots (A) demonstrating expression of cell surface markers (LAG-3, PD-1, TIGIT, TIM-3) indicating an exhaustive cell phenotype on CD4+ T cells characterised at day 0 (unstimulated, upper panels) and after 14 days stimulated with PHA (5.0 μg/ml, lower panels). Impact of PHA (5.0 μg/ml)-induced exhaustion upon expression of cell surface markers (PD-1, TIM-3, LAG-3, TIGIT, CTLA-4) on CD4+ T cells. Data presented as percentage of expressing CD4+ T cells (B), and MFI of CD4+ T cells (C), (mean + SEM, n = 4–10). The impact of PHA treatment on surface marker expression was significant (+ 2-tailed T-test, # Mann–Whitney U Test).

