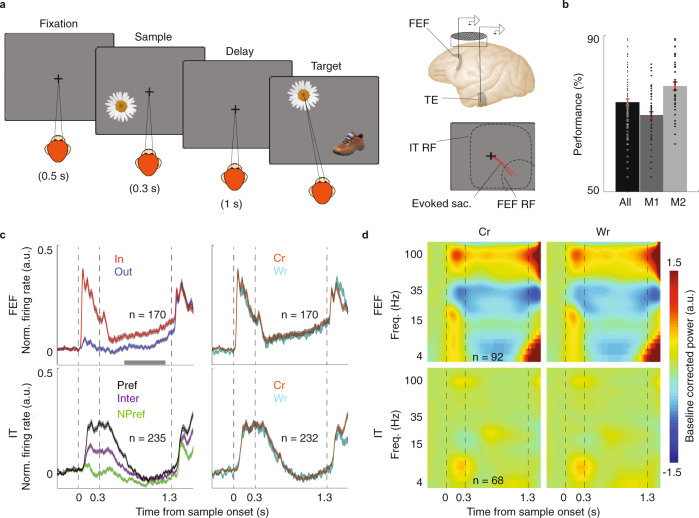
Fig. 1. Firing rate and LFP power in IT and FEF were largely unrelated to DMS performance.
a Schematic of the object DMS task. Left, After the monkey fixated, a sample stimulus appeared either in or opposite the FEF neuron’s RF location. The sample stimulus disappeared, and the monkey maintained fixation throughout a blank delay period. The same stimulus appeared again (target) along with a distracter and the monkey needed to saccade to the target stimulus to receive a reward. Right, Recordings were made simultaneously from the FEF and the TE part of IT in a single recording chamber. The FEF RF was estimated based on microstimulation-evoked saccades (red lines). The IT RF generally encompassed both sample locations. b Performance of individual monkeys (M1, M2) and their average (All) on the DMS task; points show mean performance in individual sessions; bars show mean across sessions ± SEM in red (n = 51 sessions in M1 and 41 sessions in M2). c Normalized firing rates of FEF (top) and IT populations (bottom) across the course of the DMS task, when the sample was inside (red) or outside (blue) of the neurons’ RFs, and when the sample object was preferred (black), non-preferred (green), or intermediate (violet) are shown on the left. Right, normalized firing rate of the FEF (top) and IT populations (bottom) for correct vs. wrong trials. Data (mean ± SEM) were smoothed within a window of 10 ms. d Time-frequency maps of normalized LFP spectral power for FEF (top, n = 92 LFP sites) and IT (bottom, n = 68 LFP sites) for correct (left) and wrong (right) trials.

