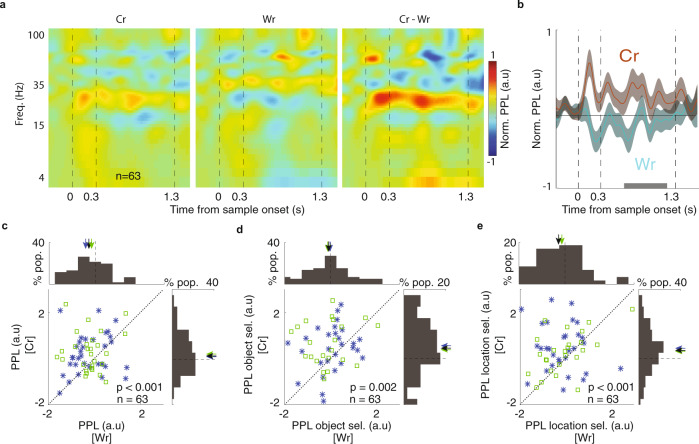
Fig. 2. Inter-areal beta coupling during correct and wrong trials.
a PPL between FEF and IT was different for Cr and Wr trials. The time-frequency map of PPL, normalized to baseline across the course of the DMS task for correct (left), wrong (middle), and the difference between Cr and Wr trials (right). b The beta band PPL during sample and delay differed between Cr and Wr trials. Plot shows the average of the beta band PPL (mean ± SEM across recorded pairs) across the course of the DMS task for the correct (brown) and wrong (cyan) trials. Gray bar indicates the analysis window for c–e. c Comparison of the beta band PPL during the delay period for correct versus wrong trials. The beta band PPL was significantly higher for correct trials (n = 63 pairs, p = 0.0009, Wilcoxon’s signed-rank test, two-sided). M1 plotted in blue and M2 in green. d Comparison of object selectivity of the beta band PPL during the delay period for correct versus wrong trials. Object selectivity of the beta band PPL was significantly higher for correct trials (n = 63 pairs, p = 0.0022, Wilcoxon’s signed-rank test, two-sided). e Comparison of spatial selectivity of the beta band PPL during the delay period of correct versus wrong trials. Spatial selectivity of the beta band PPL was significantly higher for correct trials (n = 63 pairs, p = 0.0004, Wilcoxon’s signed-rank test, two-sided).

