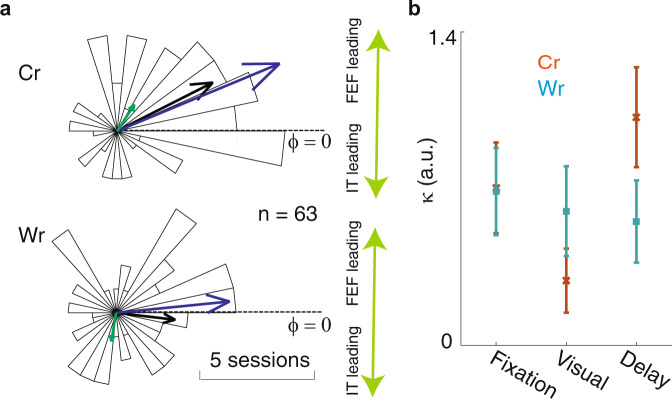
Fig. 3. Inter-areal beta coupling led by FEF.
a Beta-band phase differences between areas reflected performance. The polar plot shows a histogram of phase differences between the FEF and IT LFPs in the beta band for correct trials (top) and wrong trials (bottom, n = 63 pairs). Arrows show the circular means across all pairs, for M1 (blue), M2 (green), and both (black). b Reliability of phase difference values (κ) across sessions (mean ± SD over bootstrap distribution; bootstrap n = 1001) during the fixation, visual, and delay periods for Cr (brown) and Wr (cyan) trials.

