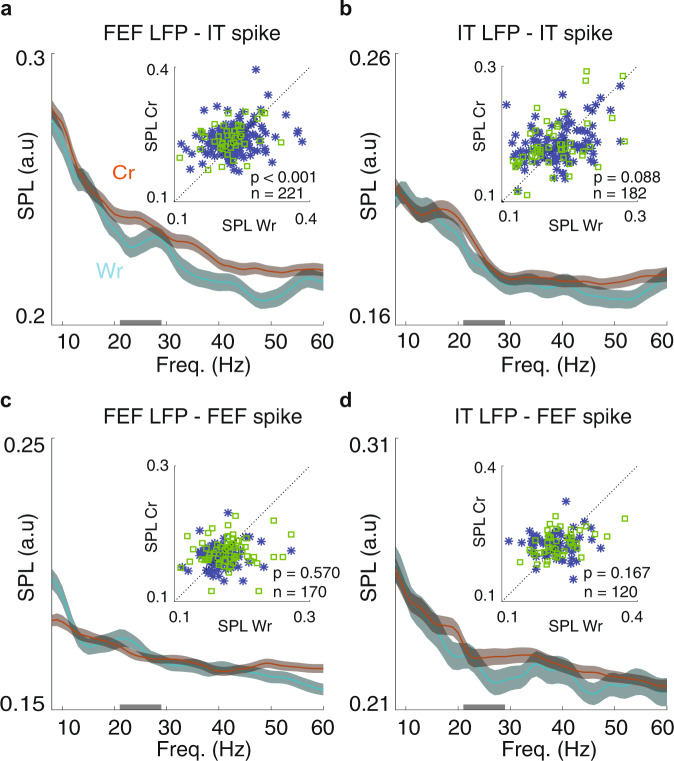
Fig. 4. IT spiking activity, coupled to FEF phase, reflected performance.
a The beta band SPL between IT spikes and FEF LFPs reflected performance. Plots show the SPL for correct (brown) and wrong (cyan) trials across frequencies for all pairs of IT units and simultaneously recorded FEF LFPs. Gray bar on x-axis indicates the beta frequency range. Data were smoothed within a window of 1 Hz and represented as mean ± SEM. Inset scatter plots compare the beta band SPL for correct vs. wrong trials (n = 221 pairs, p = 0.0009, Wilcoxon’s signed-rank test, two-sided). M1 plotted in blue and M2 in green. b–d, Plots show the SPL for correct and wrong trials across frequencies for all pairs of IT units and IT LFPs (b, n = 182 pairs, p = 0.088, Wilcoxon’s signed-rank test, two-sided), FEF units and FEF LFPs (c, n = 170 pairs, p = 0.570, Wilcoxon’s signed-rank test, two-sided), and for FEF units and IT LFPs (d, n = 120 pairs, p = 0.167, Wilcoxon’s signed-rank test, two-sided). Smoothing and scatter plot as in a.

