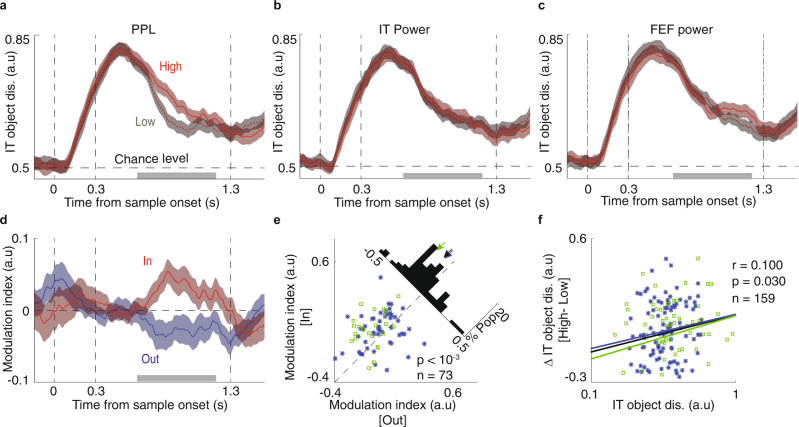
Fig. 5. Enhancement of object coding by IT spiking activity during high beta PPL.
a Object discriminability was greater on trials with high beta PPL. Time-course of the object discriminability values for High (light red) vs. Low (dark red) PPL trials for object-selective IT units (n = 74 units). Data were smoothed within a window of 1 ms and represented as mean ± SEM. Gray bar in a–d indicates portion of delay period used for analysis in e, f. b, c Object discriminability does not reflect beta power within IT (b, n = 75 units) or FEF (c, n = 72 units). Time-course of the object discriminability values for High (light red) vs. Low (dark red) beta band power trials for object-selective IT units. Smoothing and error bar as in a. d Plot shows the time-course of the modulation index of object discriminability (High vs. Low PPL trials), for In (red) and Out (blue) conditions (n = 73 units). Data were smoothed with a window of 1 ms and represented as mean ± SEM. e Scatter plot illustrates the modulation index of object discriminability (High vs. Low PPL) during the delay period for In vs. Out conditions. The histogram in the upper right shows the difference between In and Out (n = 73 units, p = 0.00018, Wilcoxon’s signed-rank test, two-sided). M1 plotted in blue and M2 in green. f Scatter plot shows the correlation between discriminability for each IT unit (x-axis) and the difference in discriminability for that unit between high and low beta PPL trials (y-axis, n = 159 units, Kendall correlation, r = 0.100, p = 0.030). Lines show fits for individual monkeys (blue, green) and combined data (black).

