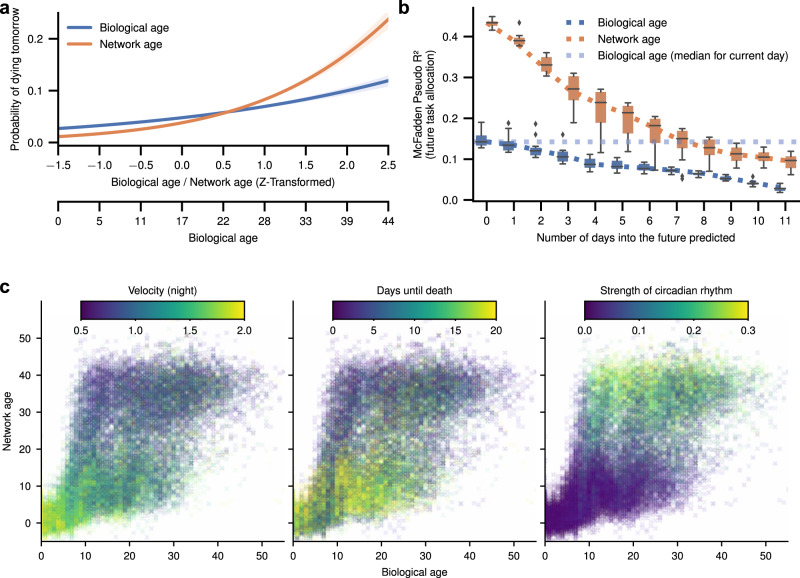
Fig. 4. Network age can be used to predict other properties, such as mortality and circadian rhythms. It also predicts an individual’s future task allocation.
a An individual’s mortality on the next day based on her age (x-axis show original and z-transformed biological age and z-transformed network age). Bees with a low network age have lower mortality than biologically young bees; bees with a high network age have higher mortality than biologically old bees (shaded areas: 95% bootstrap confidence intervals for the regression estimates). b Network age can be used to predict task allocation and future behaviors. Network age predicts the task of an individual 7 days into the future better than biological age predicts the individual’s task the same day (blue dotted line). Each box comprises N = 12 scores from models with N = 12 days of training data (center line, median; box limits, upper and lower quartiles; whiskers, 1.5× interquartile range; points, outliers). c Selected properties mapped for network age over biological age with each cross representing one individual on one day of her life. Note that for a given value on the y-axis (network age) colors are more consistent than for a given value on the x-axis (biological age).

