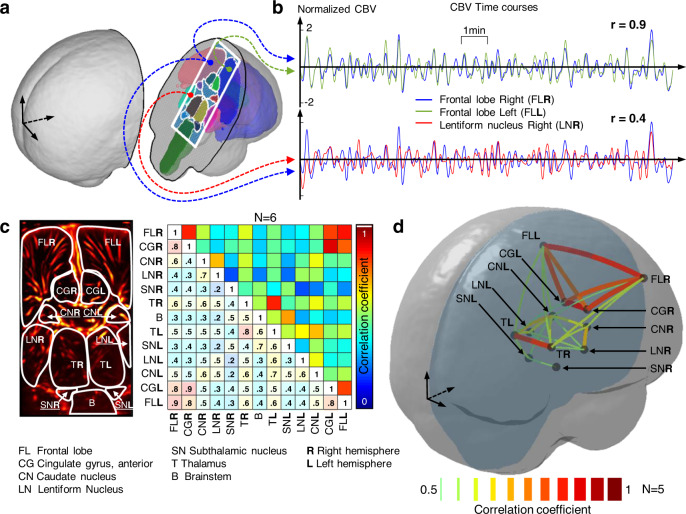
Fig. 2. fUS reveals the intra- and interhemispheric connectivity in very preterm neonates.
(CBV cerebral blood volume). a Schematic view of the ultrasound plane of interest (white rectangle) registered on MRI atlas. b Example of normalized 10-min long CBV time courses obtained with fUS and averaged over three cerebral areas. The Pearson correlation coefficients r are computed between the signals. r = 0.9 for FLR vs FLL, r = 0.4 for FLR vs LNR. c Markropoulos atlas (white boundaries) overlaid on a doppler image in the plane of interest. The CBV is averaged in each zone and the correlation coefficients are computed for every pair of CBV time courses (see panel b for an example), leading to the adjacent connectivity matrix. This matrix is obtained by averaging the results over N = 6 very preterm infants born at 28 ± 2 weeks gestation and imaged at postnatal day 9 ± 3. d “Connectome" represented as links between different cerebral regions’ centroids according to correlation coefficients. Source data are provided as a Source Data file.

