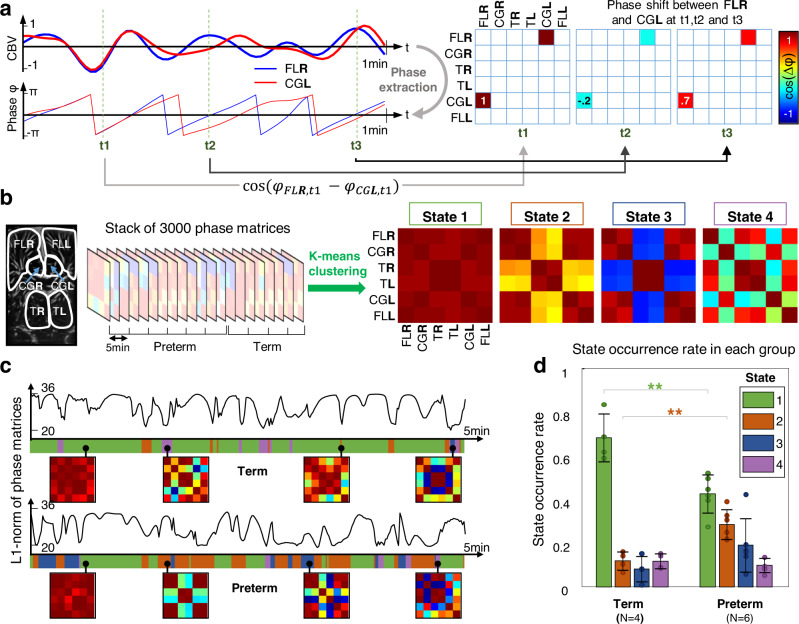
Fig. 4. Dynamic connectivity reveals a disconnection of thalamo-cortical networks for preterm neonates.
(CBV cerebral blood volume, FL frontal lobe, CG cingulate gyrus, T thalamus, R/L right/left) a Construction of the phase matrices coefficients for the right frontal lobe (FLR) and the left cingulate gyrus (CGL). The instantaneous phase is extracted from the CBV time courses. The cosine of the phase shift between FLR and CGL is reported every 1s in the phase matrix. b Si cerebral areas are included in the analysis: the frontal lobes, cingulate gyri and thalamus in left and right hemispheres. The phase matrices are concatenated in the time dimension for 10 independent 5-min-long acquisitions involving six preterm and four term-born neonates. Unsupervised k-means with L1 norm (i.e., Manhattan distance) is applied on the full phase matrix stack resulting in four connectivity states. The corresponding color scale is defined on the right of a. c Typical L1 norm time course for acquisitions on one term infant and on preterm neonate. The fluctuations of these curves give information on the dynamic phase matrix changes. The closest state to the current phase matrix is encoded in the color ribbon below each curve. Four examples of phase matrices are shown in small square boxes for each patient. The colors in the ribbon representing the different states are defined in d legend box. d Occurrence rate of each state averaged on each population (**p = 0.003, one-way ANOVA with post hoc Tukey’s tests). Error bars represent the standard deviation. Center of error bar is the mean value. N = number of independent patients in each group, with one acquisition per patient. Source data are provided as a Source Data file.

