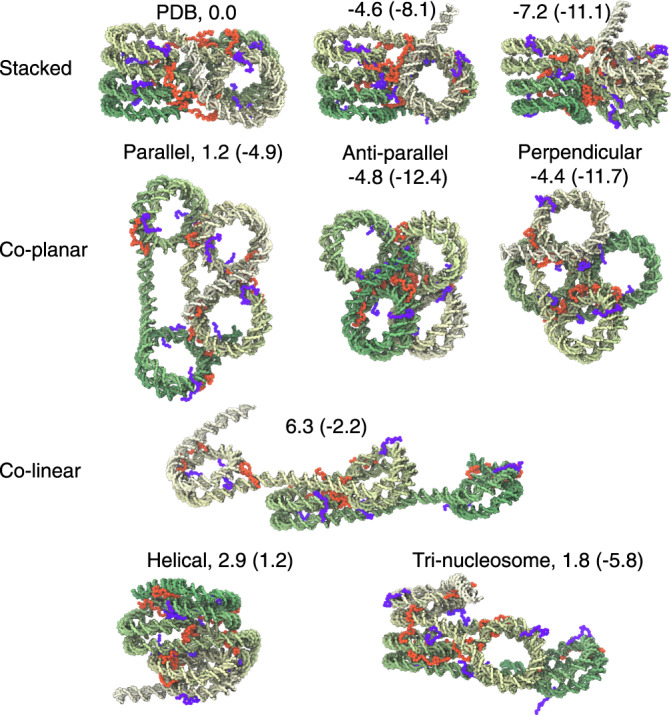
Fig. 2. Representative tetra-nucleosome configurations from K-means clustering.

See Supplementary Movie 1 for the full set of cluster structures. For clarity, only the DNA molecule, the color of which varies from green to white, is shown. The N-terminal tails of histone H3 and H4 protein are drawn in purple and orange, respectively. The numbers indicate their stability relative to the PDB structure (top left) measured in the unit of kcal/mol, and were evaluated using simulations performed with the presence of protein–protein interactions between nucleosomes. The corresponding values inside the parentheses were obtained using simulations performed without such interactions.
