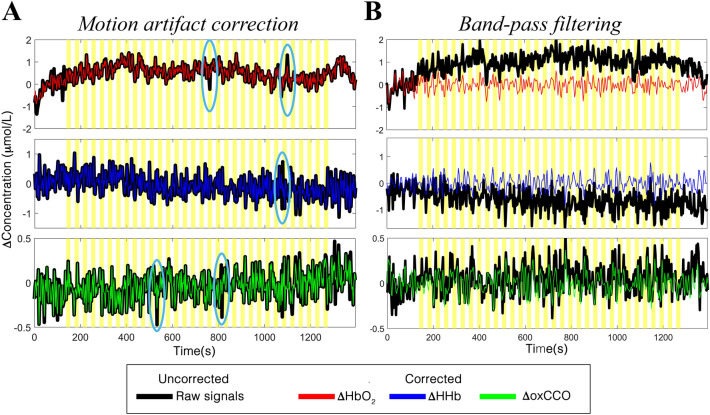
Figure 2.
Examples of the result of the application of the preprocessing steps to the ΔHbO2 (top), ΔHHb (middle), and ΔoxCCO (bottom) signals of one participant. Panel (A) shows the application of motion artifact correction method, where examples of artifacts are circled in light blue. Panel (B) shows the results of the FIR band-pass filtering. Raw uncorrected ΔHbO2/ΔHHb,/ΔoxCCO are shown in black,; processed ΔHbO2, ΔHHb, and ΔoxCCO are shown in red, blue and green respectively. Yellow areas mark the visual task blocks.

