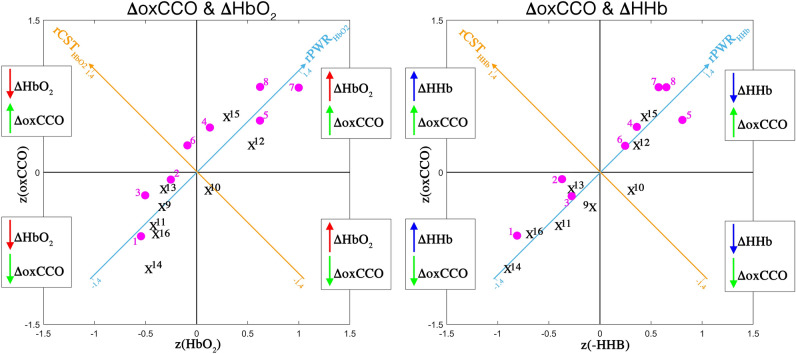
Figure 4.
Visual representation of rPWR and rCST for the Right condition. These parameters were computed from the median β-values which were z-scored across channels and then averaged across all participants, for HbO2 and oxCCO (left) and HHb and oxCCO (right) by rotating of 45° along the haemodynamics and metabolism axis, yielding to a rPWR axis (light blue) and rCST axis (orange). bNIRS channels located in the left hemisphere (# 1–8) are indicated by magenta circles and black crosses indicate channels located in the right hemisphere (# 9–16). The map is divided into four quadrants based on the direction and relative magnitude of the chromophores’ changes (greater increase or decrease) across channels.

